
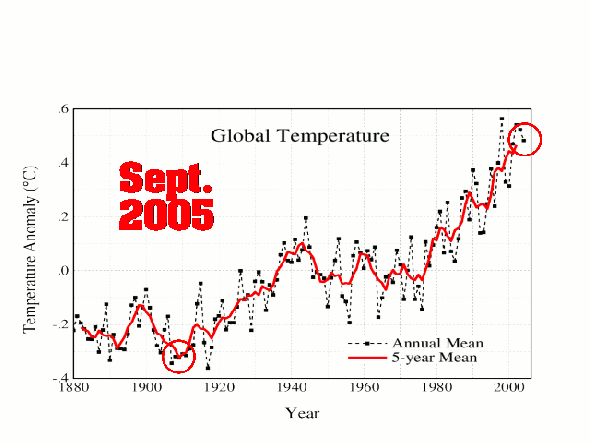
The National Climate Assessment claims unambiguous warming globally and in the US since 1880.
CSSR2017_FullReport.pdf
They show a very detailed graph and map which expresses the claimed warming.

THE Climate Change Scam : Death By GIF | CLIMATISM
“Kevin and I will keep [skeptic papers] out [of IPCC] somehow –
even if we have to redefine what peer-review literature is.”
– Phil Jones to Michael Mann | Climategate Emails
“As you know, I’m not political. If anything, I would like to see the climate change happen, so the science could be proved right, regardless of the consequences. This isn’t being political, it is being selfish.” – Phil Jones (Uni East Anglia CRU Head)
“The data doesn’t matter. We’re not basing our recommendations
on the data. We’re basing them on the climate models.”
– Prof. Chris Folland,
Hadley Centre for Climate Prediction and Research
“As we all know, this isn’t about truth at all,
it’s about plausibly deniable accusations.”
– Michael Mann (Climategate Emails)
***
THE “Hottest Year Ever” meme is just one in a long line of propaganda tools used by the Climate Crisis Industry to make you believe that the 1°C rise in global temperature since the end of the Little Ice Age – around 1880 – is “unprecedented” and will bring chaos to wildlife, humans and the planet.
HOW much of these claims are scientific, versus propaganda designed to heighten alarm around the agenda of catastrophic anthropogenic global warming (CAGW), is the centre of much conjecture and debate.
OF particular concern is how a handful of government climate ‘scientists’ have ‘homogenised’ the official surface-based temperature records to land us in the costly, hot mess we face today.
*
*
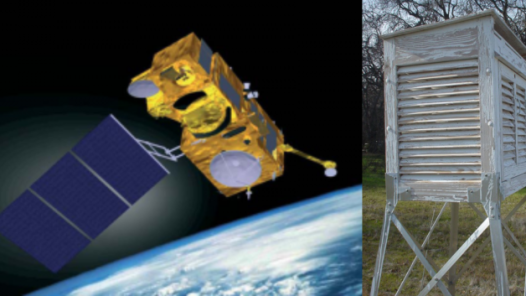
NASA’s 15 MSU and AMSU satellites generate the RSS and UAH datasets, which measure the average temperature of every cubic inch of the lower troposphere, the exact place where global warming climate change theory is meant to occur.
BEFORE 2016, UAH and RSS both tracked closely showing very little warming in their data sets which led to the identification and validation of “the pause” in global warming which has since become the subject of much research and debate in peer-reviewed scientific journals.
From the RSS website:
“The simulation as a whole are predicting too much warming” – RSS
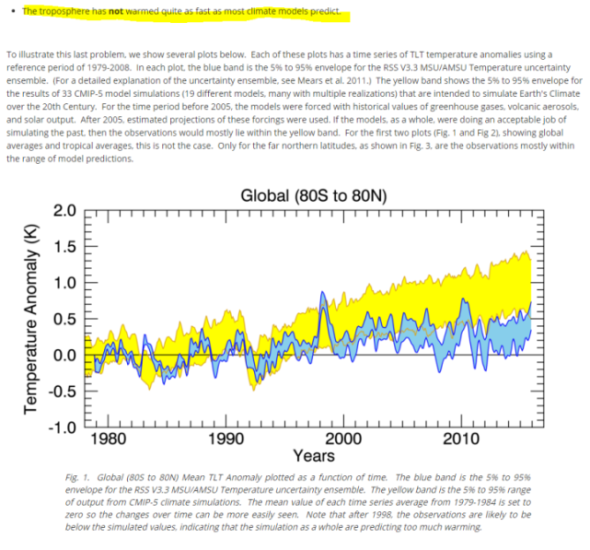
Source: http://www.remss.com/research/climate Archived here – http://www.webcitation.org/6fiQcrQDQ
HOWEVER, by 2016, Carl Mears, chief scientist for RSS (Remote Sensing Systems) decided that the lengthy and inconvenient global warming “pause” or “hiatus” was not a good look for the global warming narrative, so RSS was adjusted upwards, eliminating “the pause”.
Differences between the old version and new version of RSS:
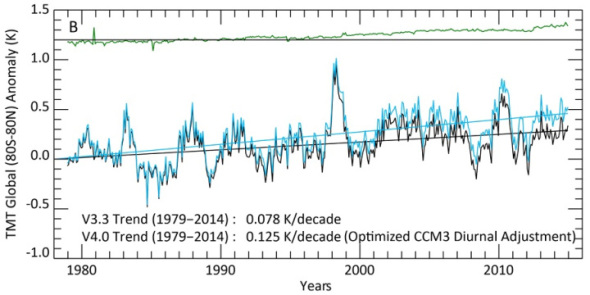
Fig. 8. Comparison between RSS V3.3 global (80°S to 80°N) anomaly time series, and result from the V4.0 merging algorithm with different levels of adjustments applied.
MEARS’ objectivity towards the business of global temperature data collection and reporting can be found in his commentary on his website, whilst making his global-warmist intentions clear by unleashing the groupthink pejorative “denialist” – in distasteful reference to NAZI holocaust denial…
Source: http://www.remss.com/blog/recent-slowing-rise-global-temperatures Archived here: http://www.webcitation.org/6fiS2rI7k
MEARS then published a paper claiming that new and improved ‘adjustments’ had “found” that missing warming.
Mears, C., and F. Wentz, 2016: Sensitivity of satellite-derived tropospheric
temperature trends to the diurnal cycle adjustment. J. Climate. doi:10.1175/JCLID-
15-0744.1, in press.
http://journals.ametsoc.org/doi/abs/10.1175/JCLI-D-15-0744.1?af=R
(Data and graphs via WUWT)
*
FOR the purpose of this post, we’ll look at the untampered UAH (University Alabama Huntsville) satellite data set run by Dr. John R. Christy – Distinguished Professor of Atmospheric Science and Director of the Earth System Science Center at The University of Alabama in Huntsville, and Roy Spencer Ph.D. – Principal Research Scientist at UAH.
SPENCER comments on the divergence between RSS and UAH post “adjustment”:
“We have a paper in peer review with extensive satellite dataset comparisons to many balloon datasets and reanalyses. These show that RSS diverges from these and from UAH, showing more warming than the other datasets between 1990 and 2002 – a key period with two older MSU sensors both of which showed signs of spurious warming not yet addressed by RSS. I suspect the next chapter in this saga is that the remaining radiosonde datasets that still do not show substantial warming will be the next to be “adjusted” upward.
The bottom line is that we still trust our methodology. But no satellite dataset is perfect, there are uncertainties in all of the adjustments, as well as legitimate differences of opinion regarding how they should be handled.
Also, as mentioned at the outset, both RSS and UAH lower tropospheric trends are considerably below the average trends from the climate models.
And that is the most important point to be made.”
Comments on the New RSS Lower Tropospheric Temperature Dataset « Roy Spencer, PhD
(Climatism bolds)
*
GLOBAL atmospheric temperatures continue their rapid decline off the record heights of the 2015/16 super El Niño, despite record and rising CO2 emissions.
UAH global average lower tropospheric temperature (LT) anomaly for December, 2018 was +0.25°C above the 40-year average:
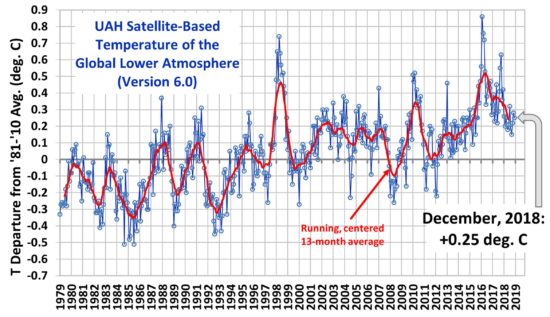
uah_lt_1979_thru_december_2018_v6-550×317
*
GLOBAL temperature dropped by a record 0.4°C in three years according to U.K. HadCRUT4 temperature data set:
DELLERS with the details :
Earth in ‘Greatest Two-Year Cooling Event in a Century’ Shock
Our planet has just experienced the most extreme two-year cooling event in a century. But where have you seen this reported anywhere in the mainstream media?
You haven’t, even though the figures are pretty spectacular. As Aaron Brown reports hereat Real Clear Markets:
From February 2016 to February 2018 (the latest month available) global average temperatures dropped 0.56°C. You have to go back to 1982-84 for the next biggest two-year drop, 0.47°C—also during the global warming era. All the data in this essay come from GISTEMP Team, 2018: GISS Surface Temperature Analysis (GISTEMP). NASA Goddard Institute for Space Studies (dataset accessed 2018-04-11 at https://data.giss.nasa.gov/gistemp/). This is the standard source used in most journalistic reporting of global average temperatures.
The 2016-18 Big Chill was composed of two Little Chills, the biggest five month drop ever (February to June 2016) and the fourth biggest (February to June 2017). A similar event from February to June 2018 would bring global average temperatures below the 1980s average. February 2018 was colder than February 1998.
To put this temperature drop in context, consider that this is enough to offset by more than half the entirety of the global warming the planet has experienced since the end of the 19th century.
Read the rest on Breitbart.
*
Global Mean Estimates based on Land and Ocean Data:
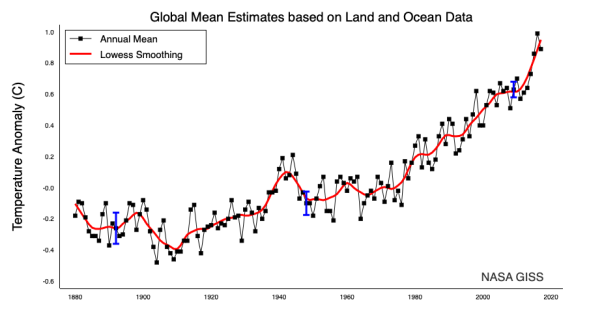
Data.GISS: GISS Surface Temperature Analysis: Analysis Graphs and Plots
*
THE 20 year global warming “Pause” has been well and truly wiped from the NASA GISS temperature record. AS has the record 2-year temperature drop, post 2015/16 El Niño – according to NASA GISS data.
BY their own admission, the ocean data is also fake.
date: Wed Apr 15 14:29:03 2009
from: Phil Jones <p.jones@uea.ac.uk> subject: Re: Fwd: Re: contribution to RealClimate.org
to: Thomas Crowley <thomas.crowley@ed.ac.uk>Tom,
The issue Ray alludes to is that in addition to the issue
of many more drifters providing measurements over the last
5-10 years, the measurements are coming in from places where
we didn’t have much ship data in the past. For much of the SH between 40 and 60S the normals are mostly made up as there is very little ship data there.Cheers
Phildi2.nu/foia/foia2011/mail/2729.txt
***
“HE who controls the past controls the future. He who controls the present controls the past.” – George Orwell
*
NOW it’s time to see how NASA GISS (Gavin Schmidt) and NOAA (Tom Karl) have created the ‘hockey-stick’ temperature rise over recent years in order to drive the Mann-made global warming agenda.
MIND-blowing adjustments to raw data that without exception – cool the past and warm the present – despite UHI (Urban Heat Island effect) undoubtedly compromising the latter parts of the modern temp record.
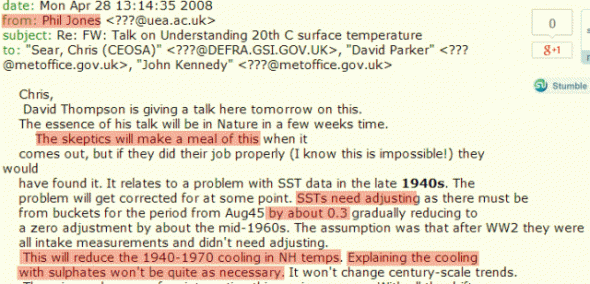
AND, if you think that the tampering of the earth’s temperature record, by cooling the past and warming the present to fit the man-made global warming narrative is another climate “denier” conspiracy theory then read this Climategate email from the UK’s leading climate expert, Phil Jones, to the UK Met Office and officials:
GLOBAL WARMING Is The Greatest And Most Successful Pseudoscientific Fraud In History | Climatism
THE problem of the 1940’s warming “blip” :

THEY did exactly what Wigley was suggesting, removing more than 0.15 C from 1940′s global temperatures. This tampering is what made the hockey stick possible.
If the present refuses to get warmer, then the past must become cooler …
Motherlode Part III | Real Science
*
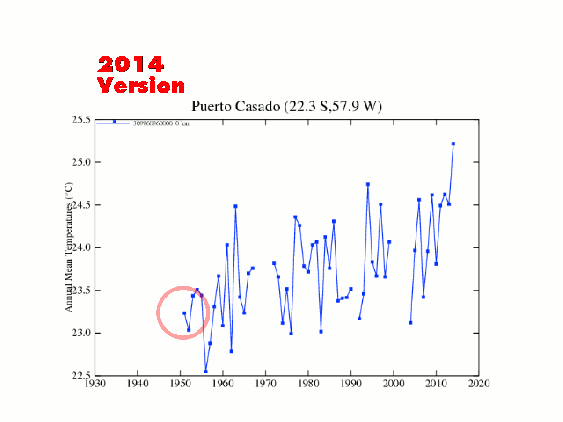
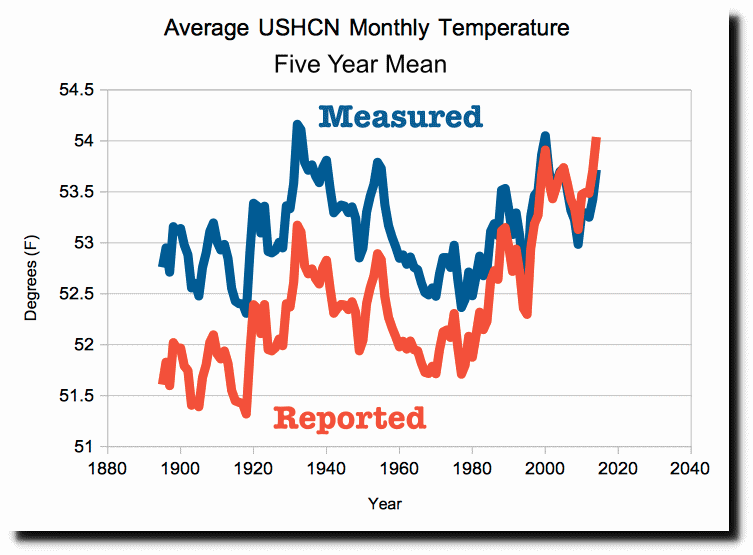
THE lack of US warming wrecks global warming theory, so NOAA and NASA reduced the “1940’s Blip” in the US record to create fake warming:

1999 Version 2017 Version
NOAA knows perfectly well that the US is not warming:

U.S. Data Since 1895 Fail To Show Warming Trend – NYTimes.com
*
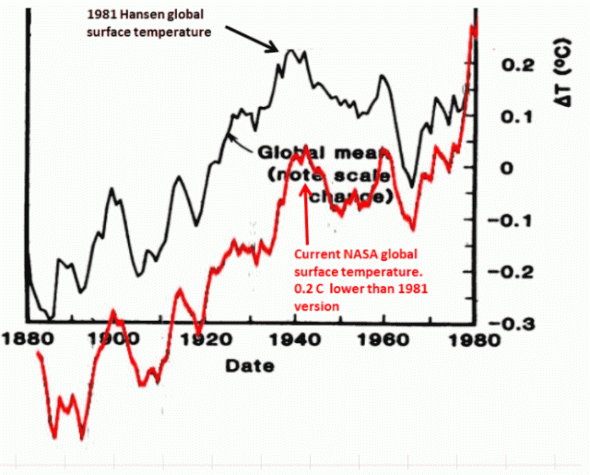
NASA has doubled global warming since 2001:
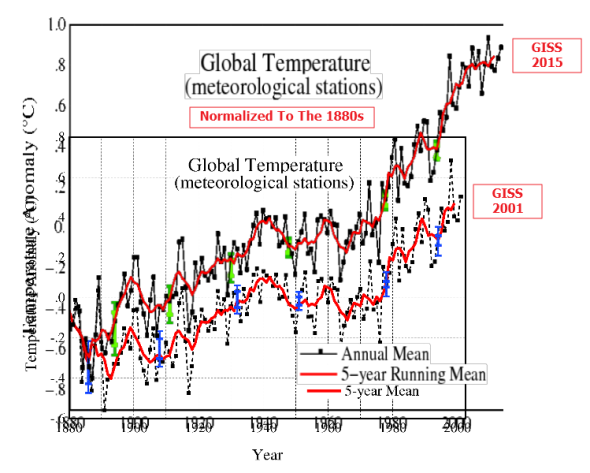
NASA Global Temperature ‘Adjustments’
NASA Global Land-Ocean Temperature ‘Adjustments’
*
NASA make up record temperatures in countries where they have no thermometer data. NOAA’s current data in Africa and much of the rest of the world is fake.
THIS enables them to make the fake “Hottest Year Ever” announcements. Memes that have more to do with PR and marketing than actual science:

Real temperatures Reported temperatures
*
Changes to GISS Iceland temperatures between V2 and V3
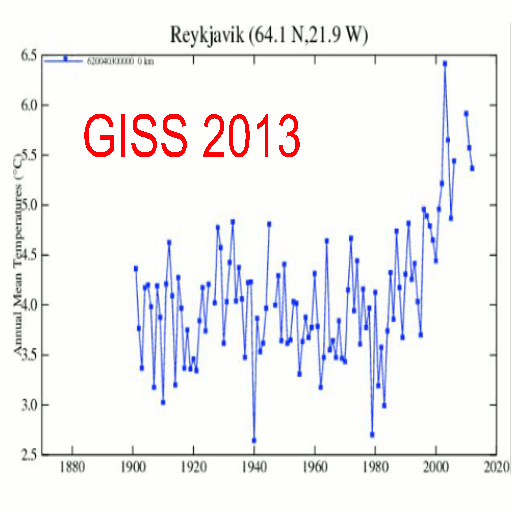
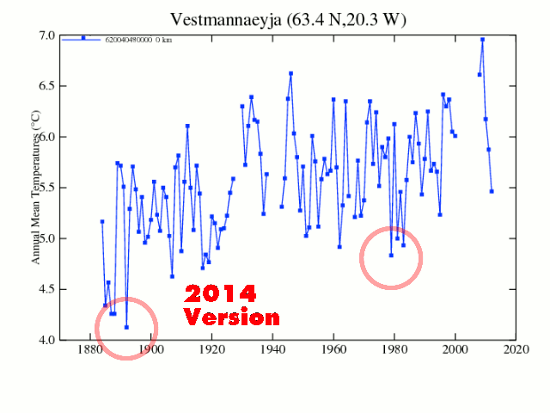
NASA didn’t like the 1940’s warmth in Greenland, so they simply made it disappear:
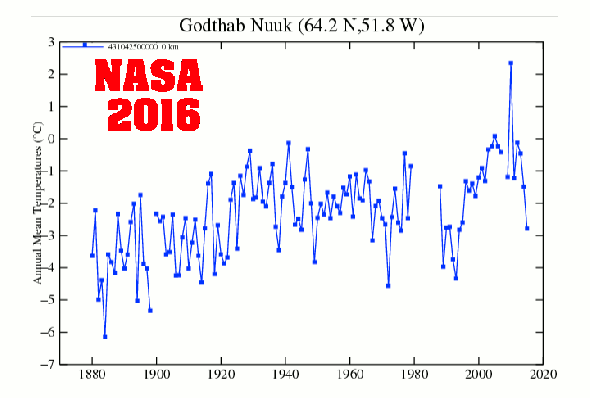
((SEE more extreme examples of NASA / NOAA temperature data fraud at Tony Heller’s superb resource: The Deplorable Climate Science Blog | “Science is the belief in the ignorance of the experts” – Richard Feynman))
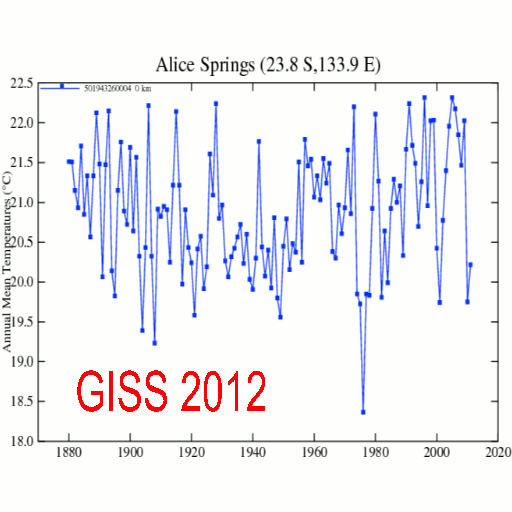
(Charts via Tony Heller “Real Climate Science”)
*
THE NASA global temperature record has been massively altered over the last 20 years to cool the past and warm the present:
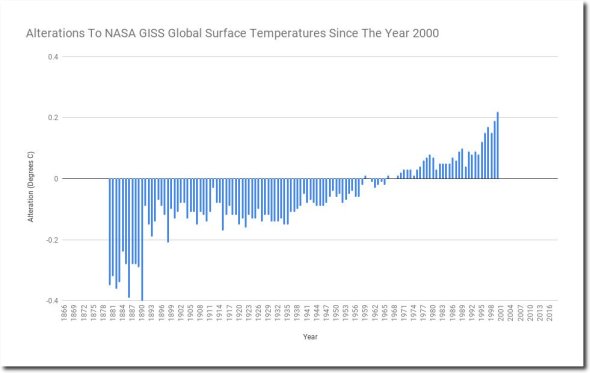
Steve Goddard on Twitter: “The @NASA global temperature record has been massively altered over the last 20 years to cool the past and warm the present.…”
*
IT’s not difficult to see why the NASA GISS data set is the preferred go-to for global warming activists, mainstream media, the UN IPCC and virtue-peddling politicians seeking to destroy cheap, efficient energy supply – namely coal-fired power – through the implementation of draconian climate change policy, and proposals like the U.S. Democrats’ “New Green Deal”, that if implemented will annihilate both the U.S. and the global economy and result in total control of every aspect of your life, lifestyle and any freedoms you currently enjoy.
NASA GISS’ Gavin Schmidt wants to use his junk science to control public policy, and says questions from policy makers are “tiresome” :
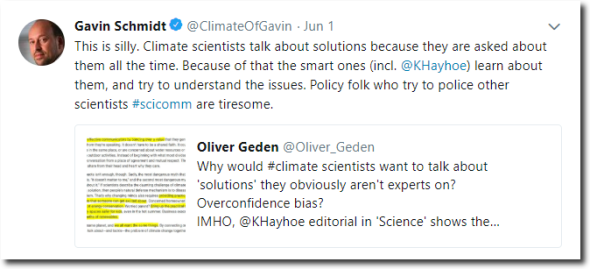
Shocking Twitter Display Of Contempt And Hubris By Stefan Rahmstorf, NASA’s Gavin Schmidt
*
PRESIDENT EISENHOWER WARNED US OF THE “danger that public policy could itself become the captive of a scientific-technological elite.”
“The prospect of domination of the nation’s scholars by Federal employment, project allocations, and the power of money is ever present — and is gravely to be regarded.
Yet, in holding scientific research and discovery in respect, as we should, we must also be alert to the equal and opposite danger that public policy could itself become the captive of a scientific-technological elite.”
President Eisenhower January 17, 1961
*
FOR so long, climate ‘sceptics’ have been labeled climate/science “deniers”, in crude reference to those who deny the holocaust, with the pejorative used in a broader effort to shut down debate and silence dissent. However, when hard evidence is laid out over alarmist rhetoric, it’s not hard to see who in fact are the real deniers of history and indeed, deniers of science.
EVEN when hard data, “the science” and empirical evidence completely contradict alarmist predictions and forecasts peddled by the mainstream media and grant-driven ‘scientists’, alarmists continue to double-down on their fear-mongering instead of evaluating their theory, adhering to the “scientific method” and admitting that they might just have got it all wrong.
*
GLOBAL WARMING dogma has ruinously snowballed into a $TRILLION dollar religion to be defended at all costs by alarmist ‘scientists’, UNreliables rent-seekers and the climate theory-obsessed mainstream media in order to protect egos, jobs, reputations and access to unlimited “Save The Planet” taxpayer trillions, completely immune to oversight.
THIS is not ‘science’, it is zealotry run amok.
IT’S time to count the shocking price we’ve paid for listening to global warming scaremongers like Tim Flannery and NASA fraudster Gavin Schmidt.
SEE now what their panic-making has inspired – global warming schemes that have hurt us infinitely more than any slight global warming could ever do.
IT has been estimated that globally, warmists burn collectively more than a $BILLION dollars a day. But, what are we trying to stop, anyway? Recent scientific papers confirm there’s been much less warming over the past two decades than predicted …
*
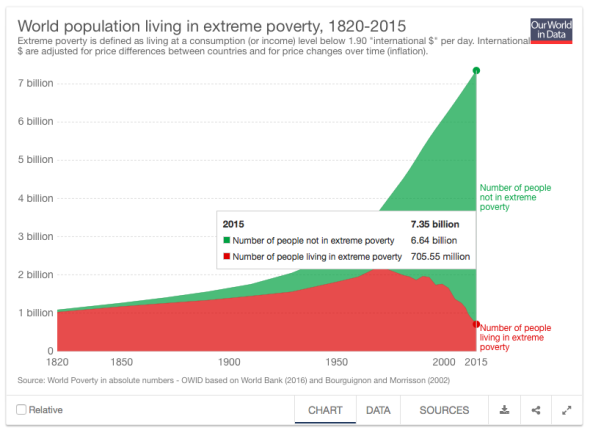
TIME to stop the rot for the sake of “science” and Western civilisation that has given us so much to be thankful for, like the dramatic drop in global poverty. Primarily due to the deployment of cheap, reliable and abundant hydrocarbon fuels. Life-giving and poverty-reducing energy sources that the zero-emissions zealots want to replace with sunshine and breezes, forcing us backwards down the energy ladder to the days of human, animal and solar power.
*
JUST as socialist central planning failed miserably before it was replaced by free market economies, green central planning will have to be discarded before Australia and other Western nations, crippled by the mad rush into costly and ruinous UNreliables, will see a return to energy security, competitive pricing and a ‘liveable’ existence for our most vulnerable.
LIKEWISE, climate data fraud must be called out and crushed with the scientific method restored to allay dangerous and costly climate change fear and alarmism.
•••
SEE also :
“GLOBAL COOLING gained considerable traction with the general public. But then, instead of cooling as long predicted by manmade climate change advocates, the planet started warming again. Something had to be done to rescue the climate change agenda from utter disaster. Enter Al Gore.”
ANOTHER Paul Driessen, must read, masterpiece…
PA Pundits - International
 By Paul Driessen ~
Although his science is often seriously wrong, no one can deny that Al Gore has a flare for the dramatic. Speaking about climate change in an October 12 PBS interview, the former vice-president proclaimed, “We have a global emergency.” Referring to the most recent UN climate report, Gore claimed it showed that current global warming “could actually extend to an existential threat to human civilization on this planet as we know it.”
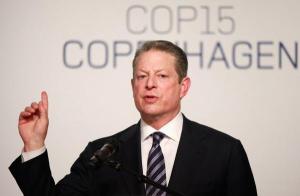 Al Gore’s overblown rhetoric makes no sense, of course. Yet his hyperbolic claims beg the question: How did this all start?
Back in the 1970s, media articles warning of imminent climate change problems began to appear regularly. TIME and Newsweek ran multiple cover stories asserting that oil companies and America’s capitalist life style were causing catastrophic damage to Earth’s climate. They claimed scientists were almost unanimous in their opinion that manmade climate change would…
View original post 990 more words
“HE who controls the past controls the future. He who controls the present controls the past.” – George Orwell
*
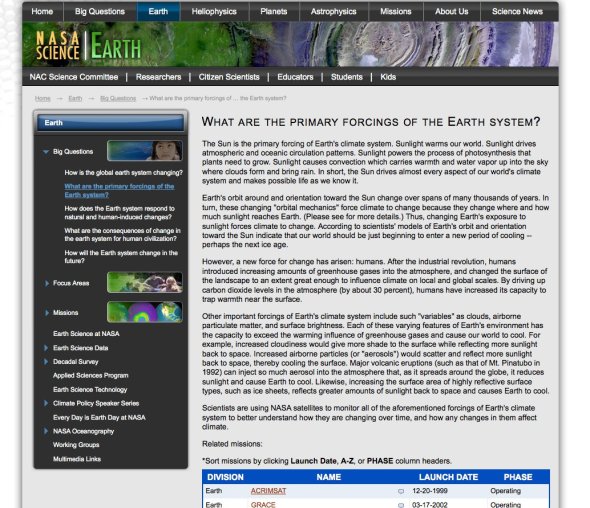
BEFORE NASA climate was captured by radical environmentalists (Hansen/Schmidt et al) and sold their soul to the widely debunked “97% of scientists believe that CO2 is the climate control knob” groupthink virus, they knew perfectly well that the sun controlled Earth’s climate.
AND, before the new-NASA-activists rewrote climate ‘science’, the National Aeronautics Space Agency boldly (and correctly) noted that “Other important forcings of Earth’s climate system” such as “clouds, airborne particulate matter, and surface brightness [have] the capacity to exceed the warming influence of greenhouse gases and cause our world to cool.”
NASA – It’s The Sun Stupid!
FROM the above NASA article that disappeared around 2010 :
WHAT ARE THE PRIMARY FORCINGS OF THE EARTH SYSTEM?
The Sun is the primary forcing of Earth’s climate system. Sunlight warms our world. Sunlight drives atmospheric and oceanic circulation patterns. Sunlight powers the process of photosynthesis that plants need to grow. Sunlight causes convection which carries warmth and water vapor up into the sky where clouds form and bring rain. In short, the Sun drives almost every aspect of our world’s climate system and makes possible life as we know it.
Earth’s orbit around and orientation toward the Sun change over spans of many thousands of years. In turn, these changing “orbital mechanics” force climate to change because they change where and how much sunlight reaches Earth. Thus, changing Earth’s exposure to sunlight forces climate to change. According to scientists’ models of Earth’s orbit and orientation toward the Sun indicate that our world should be just beginning to enter a new period of cooling — perhaps the next ice age.
However, a new force for change has arisen: humans. After the industrial revolution, humans introduced increasing amounts of greenhouse gases into the atmosphere, and changed the surface of the landscape to an extent great enough to influence climate on local and global scales. By driving up carbon dioxide levels in the atmosphere (by about 30 percent), humans have increased its capacity to trap warmth near the surface.
Other important forcings of Earth’s climate system include such “variables” as clouds, airborne particulate matter, and surface brightness. Each of these varying features of Earth’s environment has the capacity to exceed the warming influence of greenhouse gases and cause our world to cool. For example, increased cloudiness would give more shade to the surface while reflecting more sunlight back to space. Increased airborne particles (or “aerosols”) would scatter and reflect more sunlight back to space, thereby cooling the surface. Major volcanic eruptions (such as that of Mt. Pinatubo in 1992) can inject so much aerosol into the atmosphere that, as it spreads around the globe, it reduces sunlight and cause Earth to cool. Likewise, increasing the surface area of highly reflective surface types, such as ice sheets, reflects greater amounts of sunlight back to space and causes Earth to cool.
Scientists are using NASA satellites to monitor all of the aforementioned forcings of Earth’s climate system to better understand how they are changing over time, and how any changes in them affect climate.
science.nasa.gov/…/what-are-the-primary-causes-of-the-earth-system-variability
2018

Access denied | Science Mission Directorate
*
*
H/t @ApafarkasAgmand Read the rest of this entry »
ACCORDING to NASA data, the recent 0.56°C plunge in global temperatures, following the 2015/16 super El Niño, is the greatest two-year cooling event in a century. “You have to go back to 1982-84 for the next biggest two-year drop, 0.47°C—also during the global warming era.”
NASA’s MSU satellite measurement systems, generate the RSS and UAH datasets, which measure the average temperature of every cubic inch of the lower atmosphere (0-10 kms), the exact place where global warming theory is meant to occur.
MAY TEMPS +0.18C ABOVE AVERAGE
GLOBAL temps continue their cooling trend, rebounding off the 2015/16 Super El Niño – the strongest since accurate measurements began, caused by surface waters in the Pacific Ocean, west of Central America rising up to 3C warmer than usual.
GREENHOUSE GAS THEORY CHECK?
THE latest UAH V6.0 May anomaly of +0.18 brings temperatures back to the levels they were at the beginning of the Century, reinforcing the current 18+ year global warming “pause”, despite record and rising CO2 emissions…
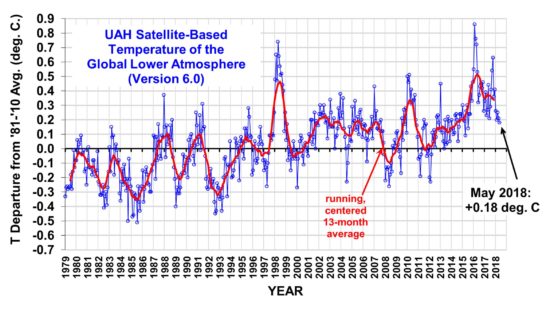
UAH Global Temperature Update for May, 2018- +0.18 deg. C « Roy Spencer, PhD
Latest Global Average Tropospheric Temperatures
Since 1979, NOAA satellites have been carrying instruments which measure the natural microwave thermal emissions from oxygen in the atmosphere. The intensity of the signals these microwave radiometers measure at different microwave frequencies is directly proportional to the temperature of different, deep layers of the atmosphere. Every month, John Christy and I update global temperature datasets that represent the piecing together of the temperature data from a total of fifteen instruments flying on different satellites over the years. A discussion of the latest version (6.0) of the dataset is located here.
The graph above represents the latest update; updates are usually made within the first week of every month. Contrary to some reports, the satellite measurements are not calibrated in any way with the global surface-based thermometer records of temperature. They instead use their own on-board precision redundant platinum resistance thermometers (PRTs) calibrated to a laboratory reference standard before launch.
Latest Global Temps « Roy Spencer, PhD
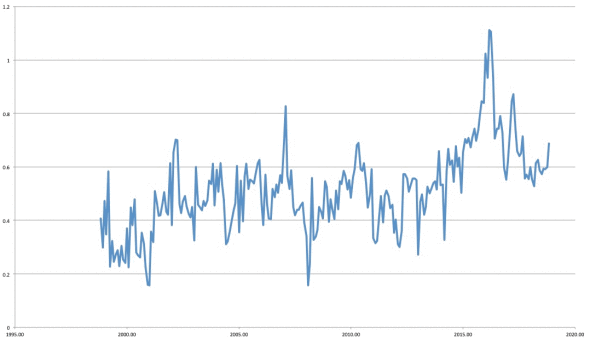
CO2 CONCENTRATION Vs TEMPS – Correlation?
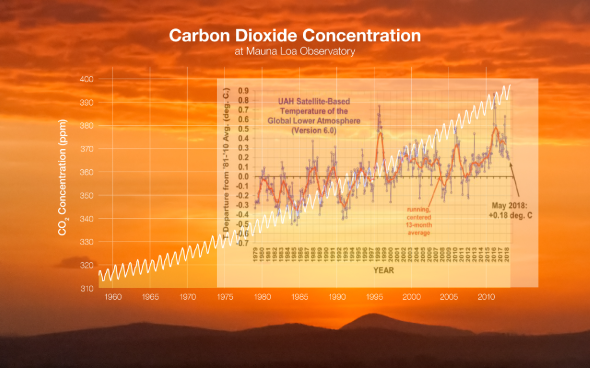
CO2 Vs Temp Correlation 1979-2018 CLIMATISM
*
Satellites Vs Thermometers?

NASA’s MSU satellite measurement systems, generate the RSS and UAH datasets, which measure the average temperature of every cubic inch of the lower atmosphere, the exact place where global warming theory is meant to occur. Read the rest of this entry »

The Sun – Educational facts and history of the star we call The Sun
***
LAST week we analysed the profound effect that the Sun has on Earth’s climate and the sinister reasons as to why the Climate Crisis Industry almost completely dismisses it as having any effect on climate and weather:
THE SUN : Climate Control Knob, Enemy Of The Climate Cult | Climatism
THROUGH the forensic lens of Tony Heller’s excellent research, let’s take a deeper dive into the ‘conveniently’ dismissed nuclear-powered giant in the sky that has the ability to generate temperature swings of 40 degrees centigrade on any given day. And whose light, that takes 8 minutes and 20 seconds to reach Earth, delivers enough energy in one hour to power the world economy for an entire year! Read the rest of this entry »
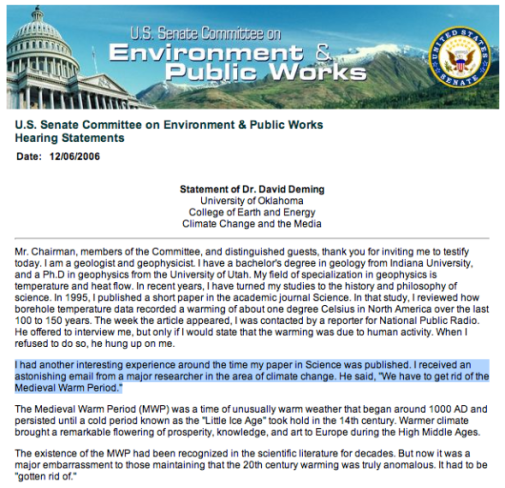
https://www.epw.senate.gov/hearing_statements.cfm?id=266543
WHEN you are a man-made global warming alarmist prosecuting your case as “unprecedented”, you need to make sure that no recent climate era was as warm or warmer than the present, even if that means having to rewrite the past to fit your theory.
THE Medieval Warm Period, also known as the Medieval Climate Optimum (for obvious reasons) existed a short time ago in the climate record, from c. 950 to c. 1250., and has remained a thorn in the side for modern “global warming” catastrophists…
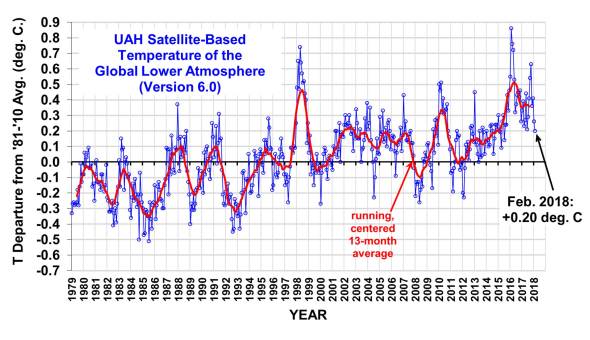
UAH Global Temperature Update for February, 2018: +0.20 deg. C « Roy Spencer, PhD
GLOBAL temps continue their cooling trend, rebounding off the 2015/16 Super El Niño – the strongest since accurate measurements began, caused by surface waters in the Pacific Ocean, west of Central America rising up to 3C warmer than usual.
THE latest UAH V6.0 February anomaly of +0.20 brings temperatures back to the levels they were at after the 1998 El Niño.
UAH Feb data and results here…
*
MEASURING GLOBAL TEMPERATURES – Satellites Vs Thermometers? Read the rest of this entry »
WITHOUT a shadow of a doubt, the greatest scientific hoax ever perpetrated against mankind is that human’s modern life (including your sandwich) is causing catastrophic “climate change” or “global warming” or “climate disruption” or “climate breakdown”, depending on the day and the activist concerned.
THIS must watch 5 minute video, backed up by peer-reviewed-scientific-evidence and verifiable government data, exposes the climate fraud rather masterfully…
Top 10 Climate Change Lies Exposed – YouTube
•••
Related :

AS the old saying goes “Sunlight is said to be the best of disinfectants“. One man who has been tireless and paid-less (sic) in the pursuit of exposing the blatant and unequivocal global temperature data fraud, executed by taxpayer funded government scientific agencies worldwide, has been Tony Heller aka Steve Goddard.
THERE are literally thousands upon thousands of mind-blowing examples of temperature data manipulation/fraud carried out in-plain-sight by climate activist agencies namely – NOAA, NASA, BoM, Met Office UK – who happen to be the literal gate-keepers of global temperature. They do this simply to make you believe that the climate is warming catastrophically thanks to your carbon dioxide (energy) emissions.
THE blink giff included in this post is really all one needs to know about how climate scientists literally “change the data to fit the theory” – a quote linked to Hungarian Marxist Georg Lukacs in his ‘Tactics and Ethics’ (1923) though often associated with Albert Einstein as a non-literal quip.
OTHER than driving the climate scare and maintaining taxpayer funding to the tune of $Trillions worldwide, hysterical claims of the “hottest year, month, day ever” tell us far more about global warming climate change marketing than they do about actual ‘science’.
*
Via Tony Heller’s “The Deplorable Climate Science Blog“ :
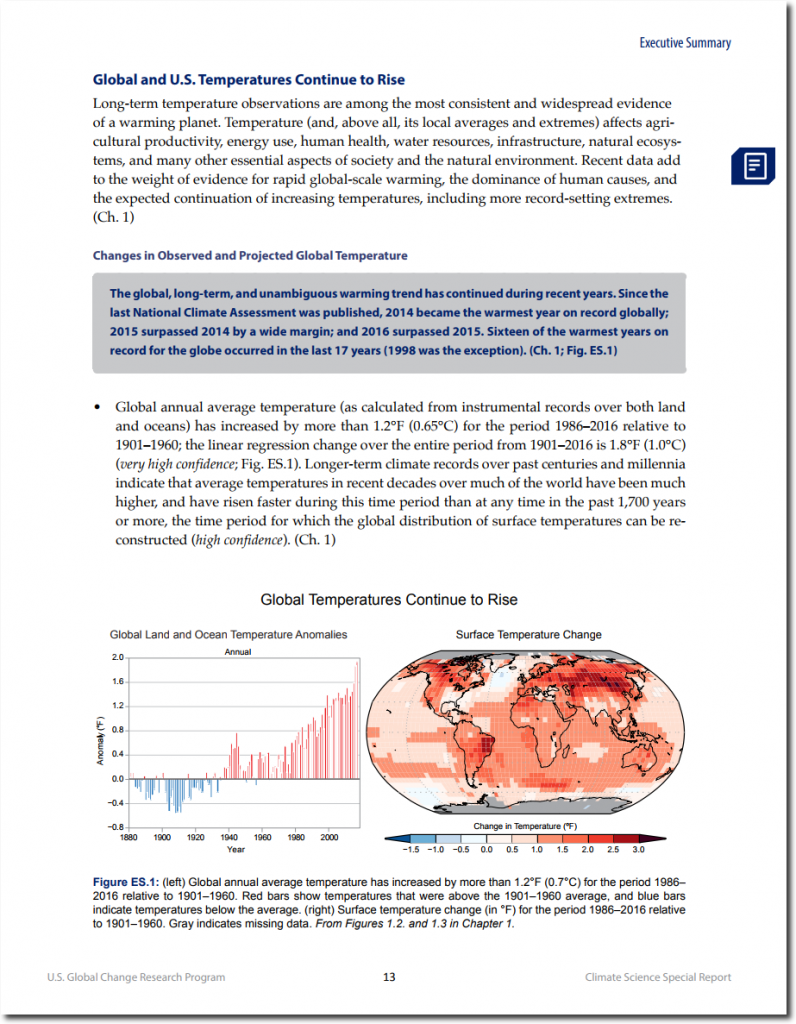
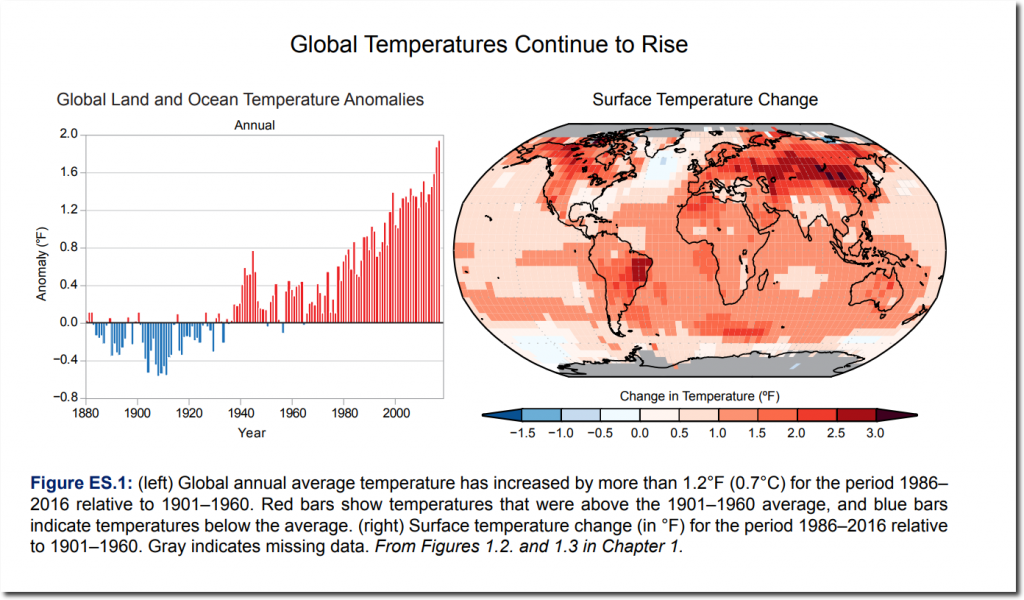
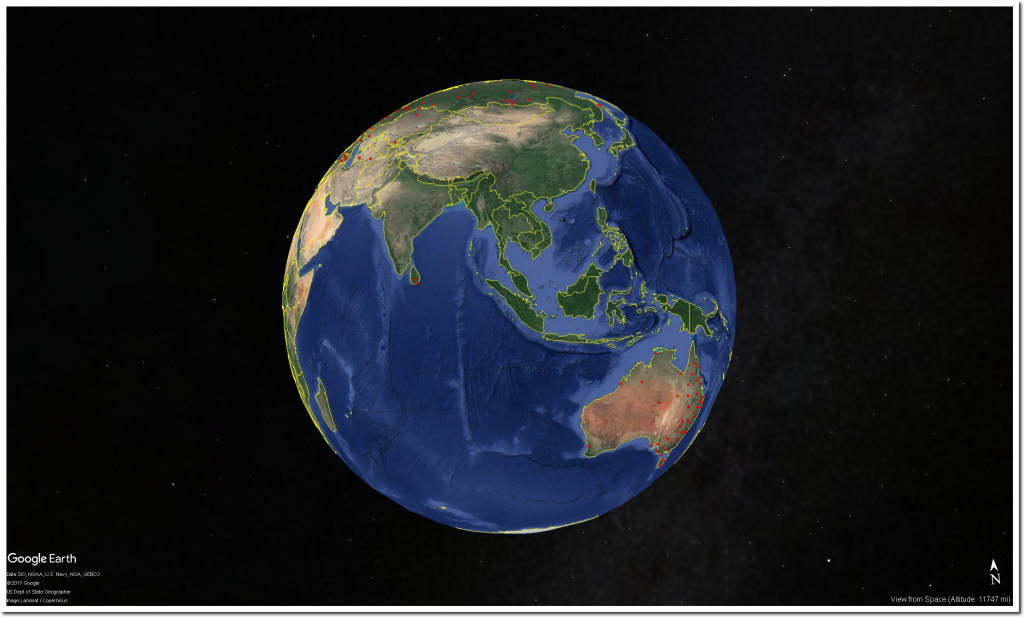
The National Climate Assessment claims unambiguous warming globally and in the US since 1880.
CSSR2017_FullReport.pdf
They show a very detailed graph and map which expresses the claimed warming.
All that red looks pretty scary. Red is the color of fire, and it isn’t hard to convince some people that their carbon sins will lead to hell fire.
What they aren’t telling is that their graph and map are fake. They have no idea what global temperatures were in 1880, 1900, 1920, 1940, or in fact the present, because outside of the US there is very little verifiable data.
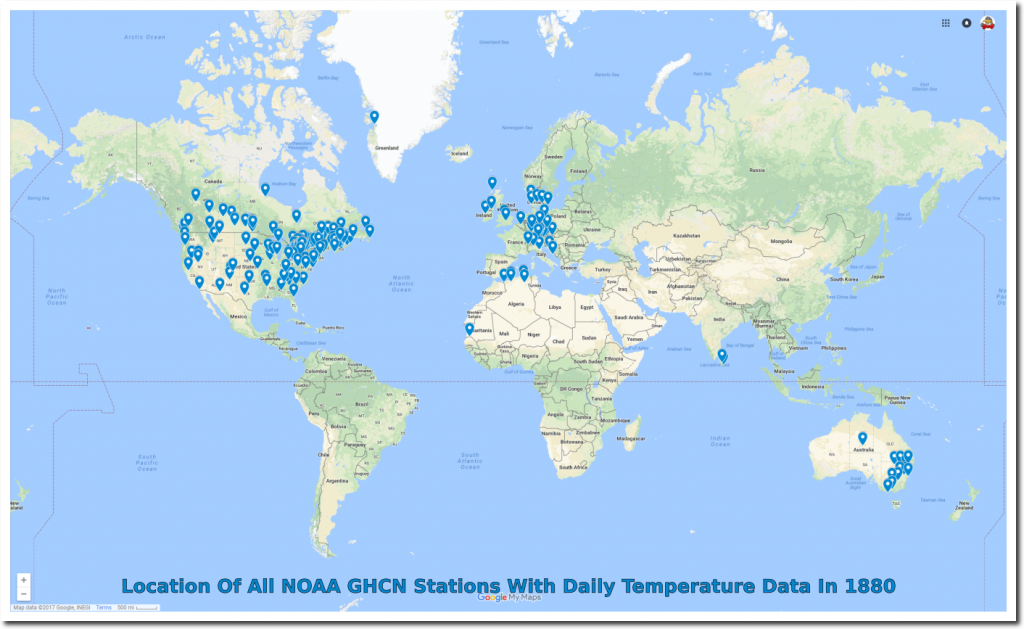
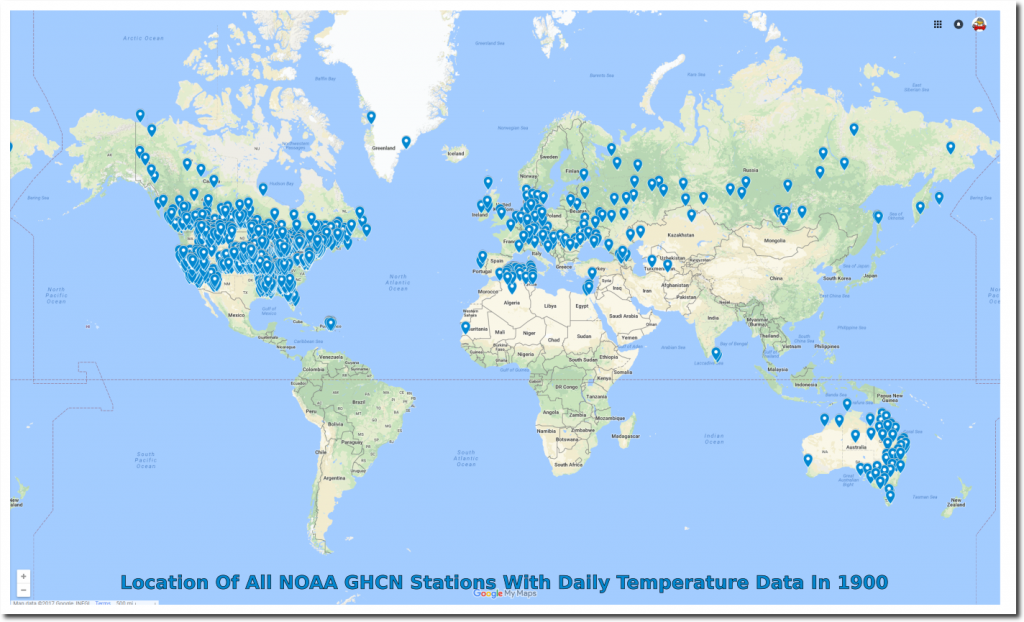
ftp://ftp.ncdc.noaa.gov/pub/data/ghcn/daily/ghcnd-inventory.txt
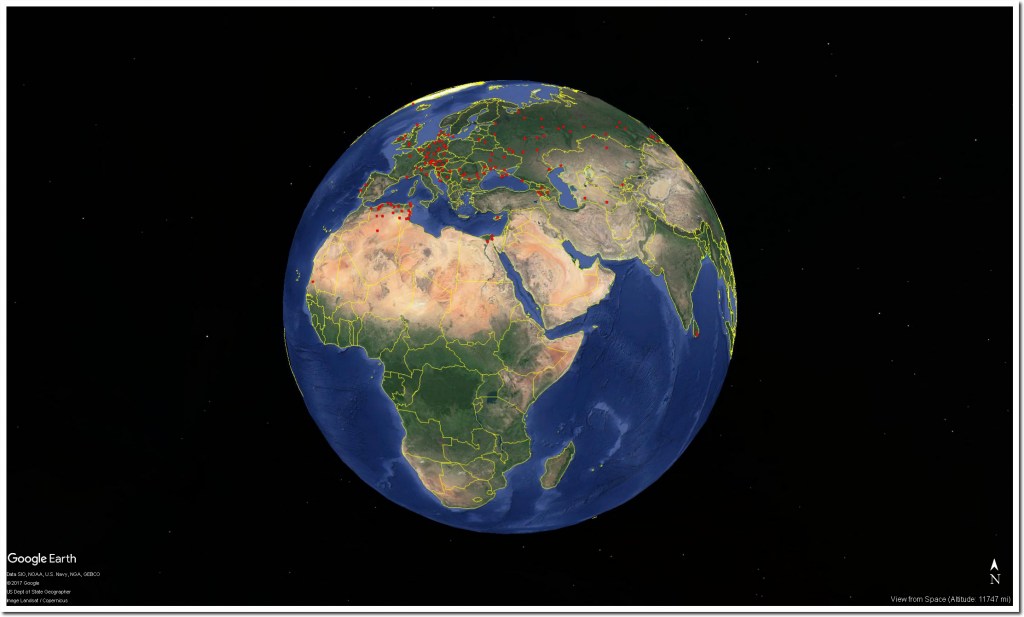
As late as 1940, there was almost no daily coverage of South America or Africa.
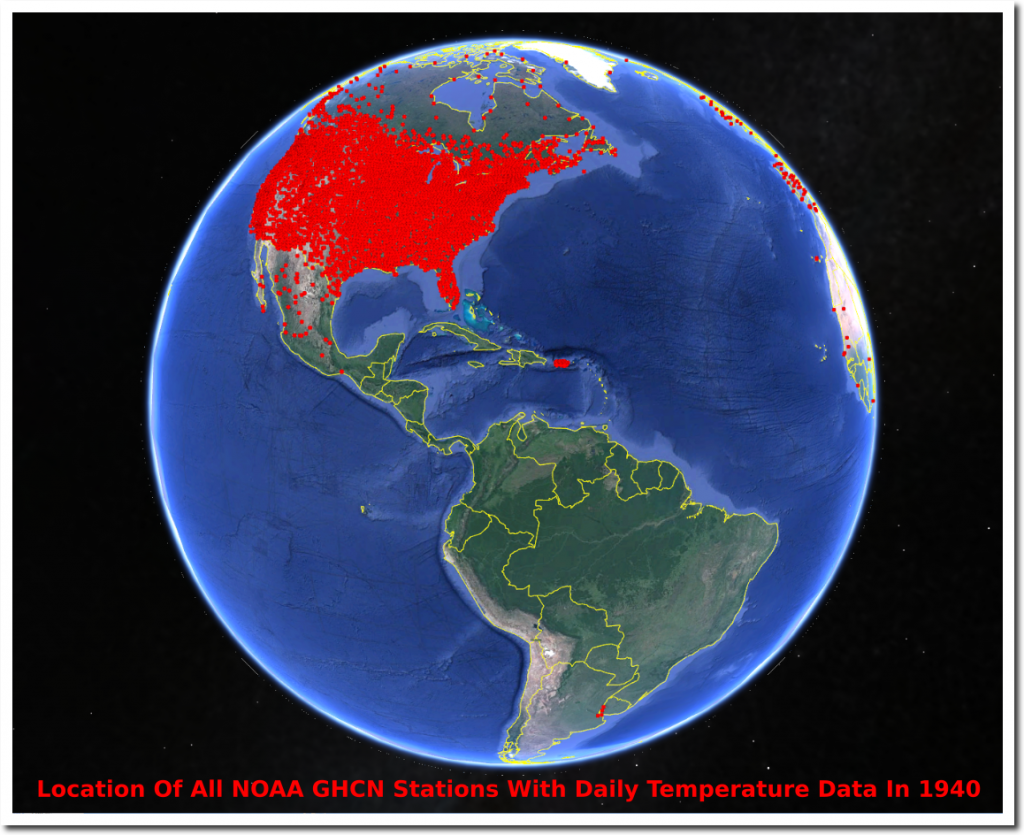
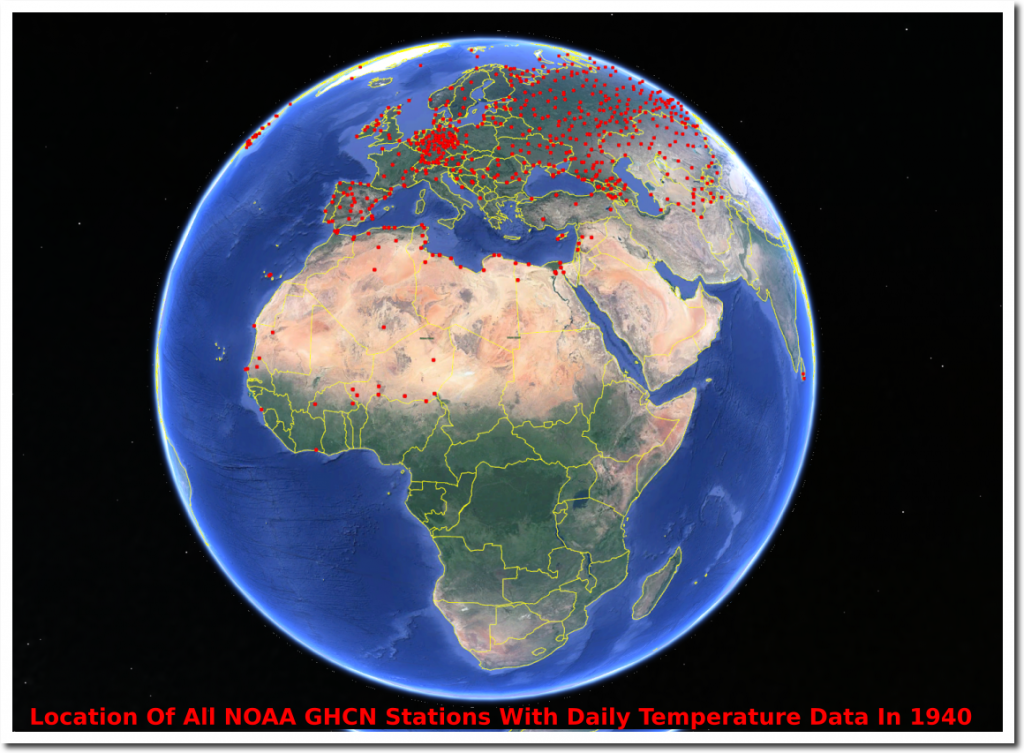
ftp://ftp.ncdc.noaa.gov/pub/data/ghcn/daily/ghcnd-inventory.txt
NOAA’s current data in Africa and much of the rest of the world is still fake. They make up record temperatures in countries where they have no thermometer data.
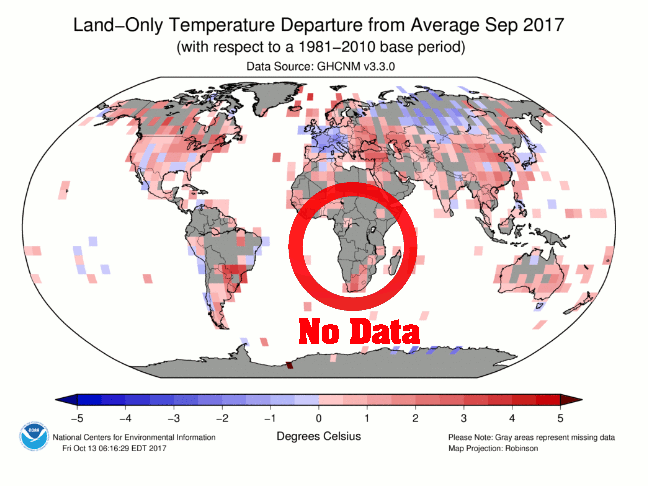
Real temperatures Reported temperatures
By their own admission, the ocean data is also fake.
date: Wed Apr 15 14:29:03 2009
from: Phil Jones <p.jones@uea.ac.uk> subject: Re: Fwd: Re: contribution to RealClimate.org
to: Thomas Crowley <thomas.crowley@ed.ac.uk>Tom,
The issue Ray alludes to is that in addition to the issue
of many more drifters providing measurements over the last
5-10 years, the measurements are coming in from places where
we didn’t have much ship data in the past. For much of the SH between 40 and 60S the normals are mostly made up as there is very little ship data there.Cheers
Phildi2.nu/foia/foia2011/mail/2729.txt
The only location on Earth with good long term daily temperature data in the US.
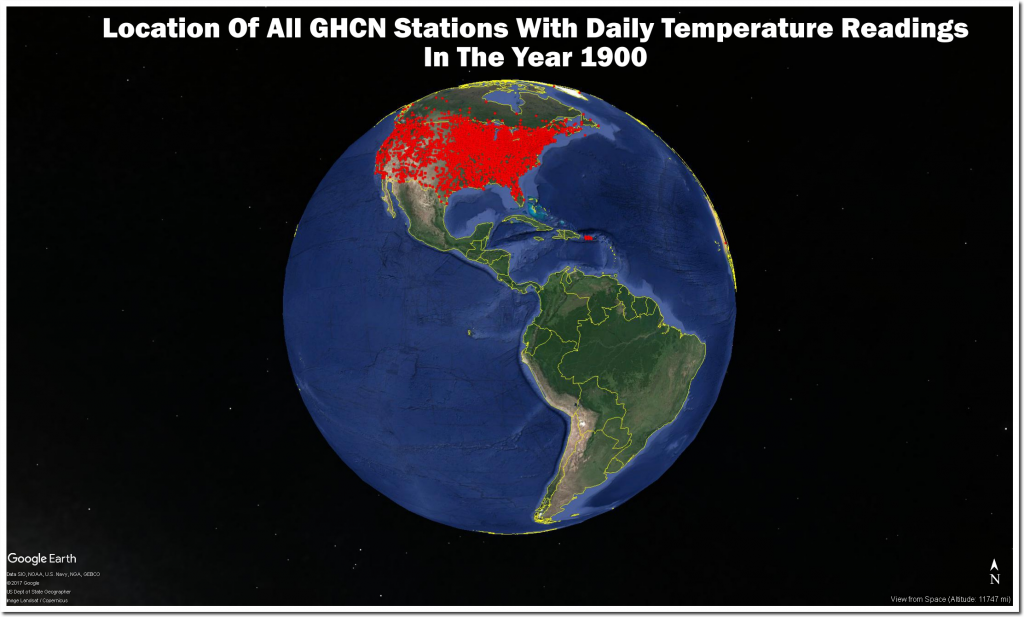
ftp://ftp.ncdc.noaa.gov/pub/data/ghcn/daily/ghcnd-inventory.txt
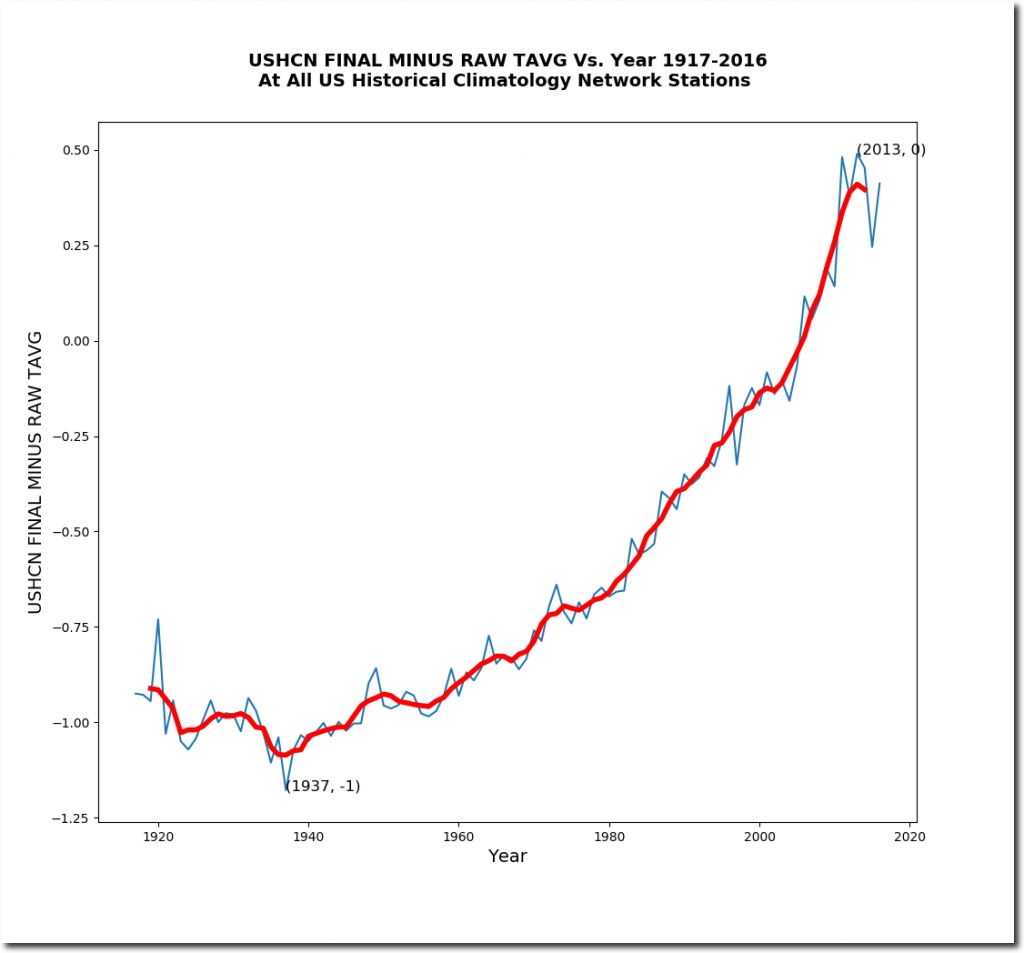
Before NOAA tampers with their data, the US shows no warming over the past century.
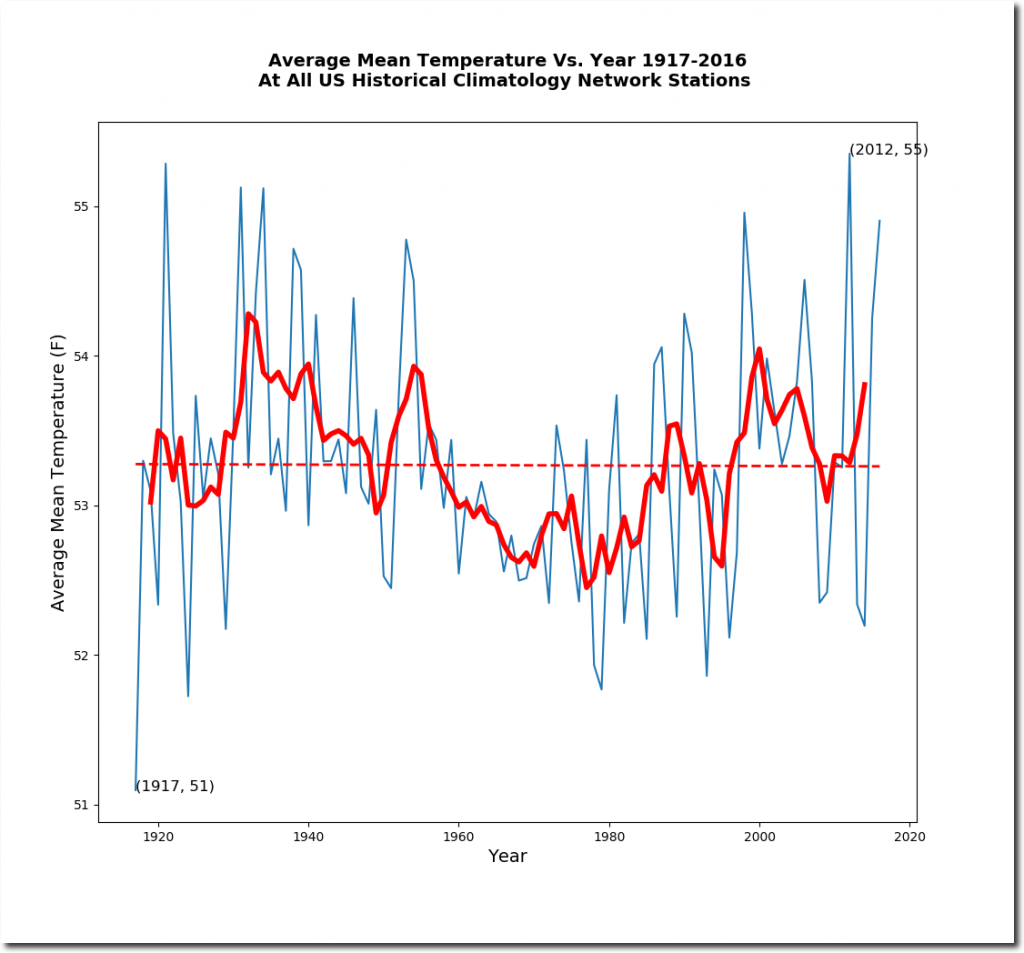
The lack of US warming wrecks global warming theory, so NOAA and NASA tamper with their own data to create fake warming.
1999 Version 2017 Version
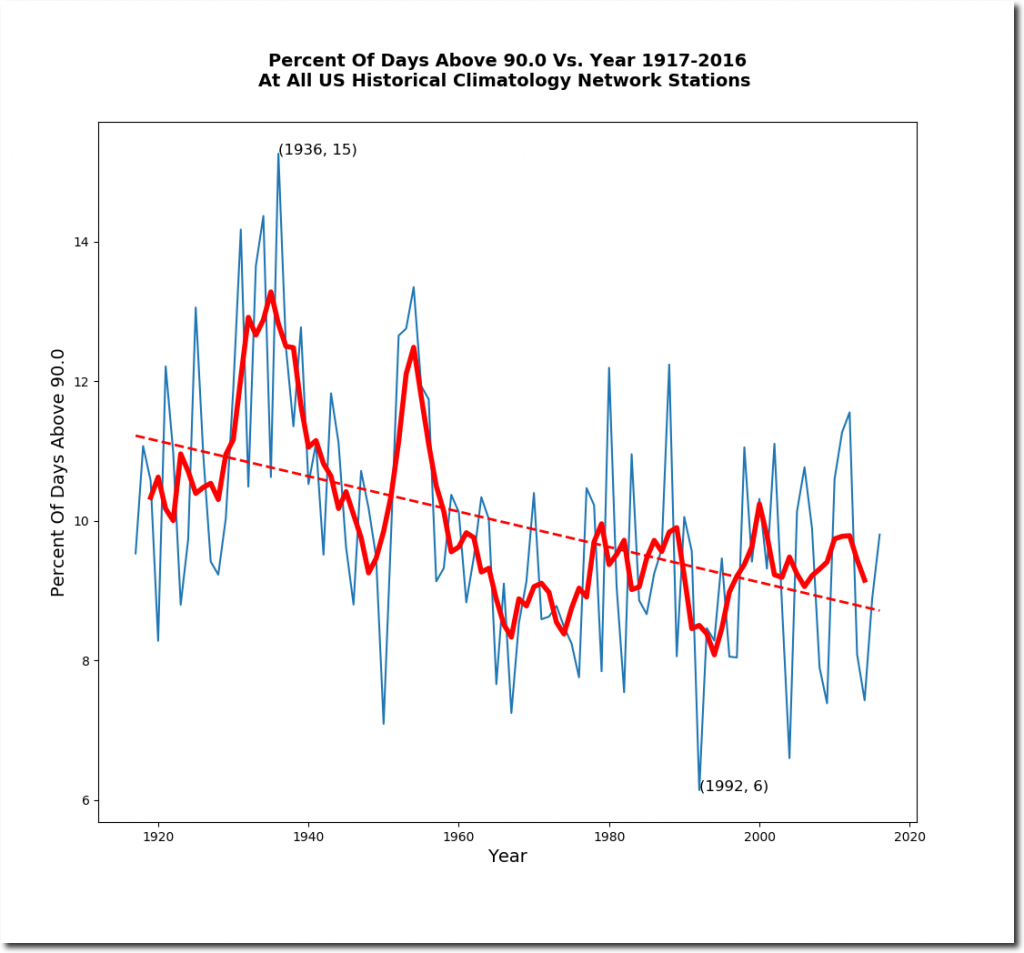
The frequency and coverage of hot weather has plummeted in the US over the past century. The US isn’t getting hotter – afternoons are getting cooler.
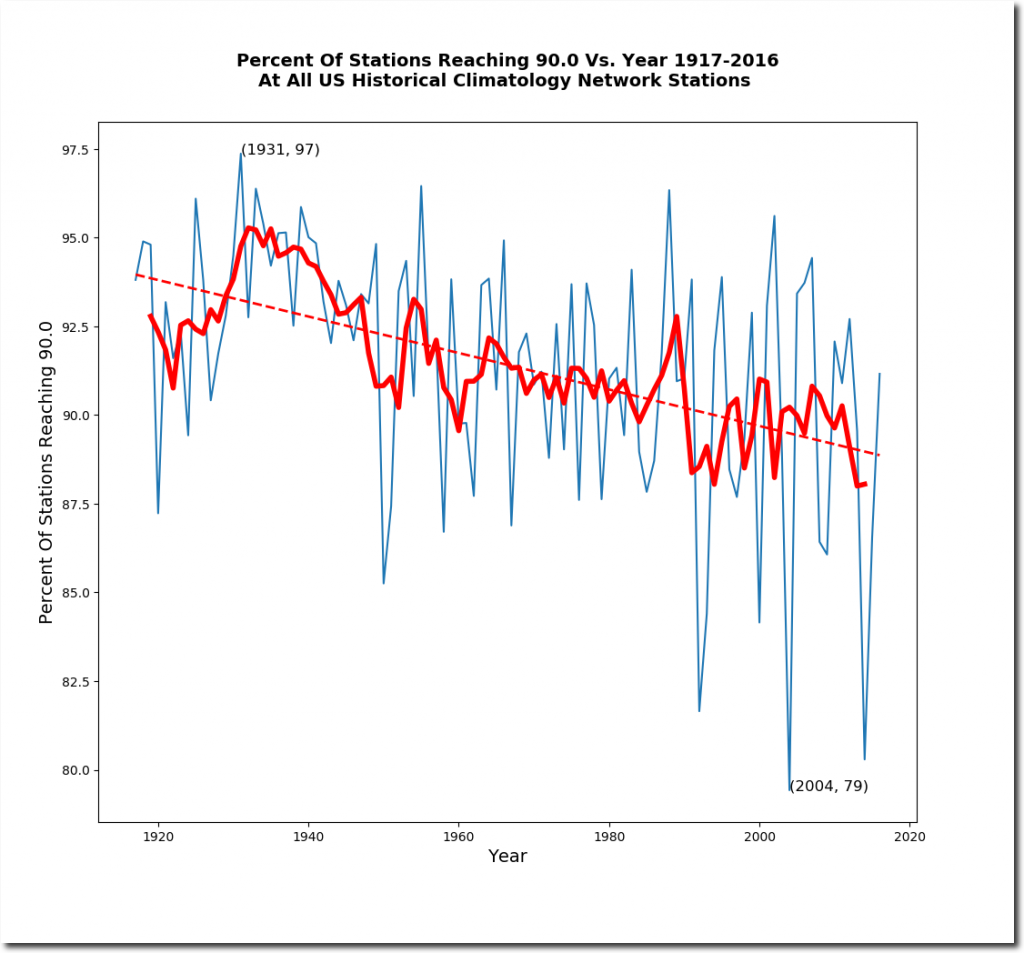
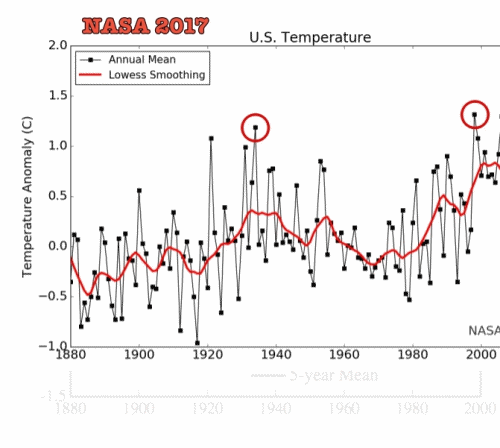
The US temperature data is tampered with by NOAA in a massive hockey stick.
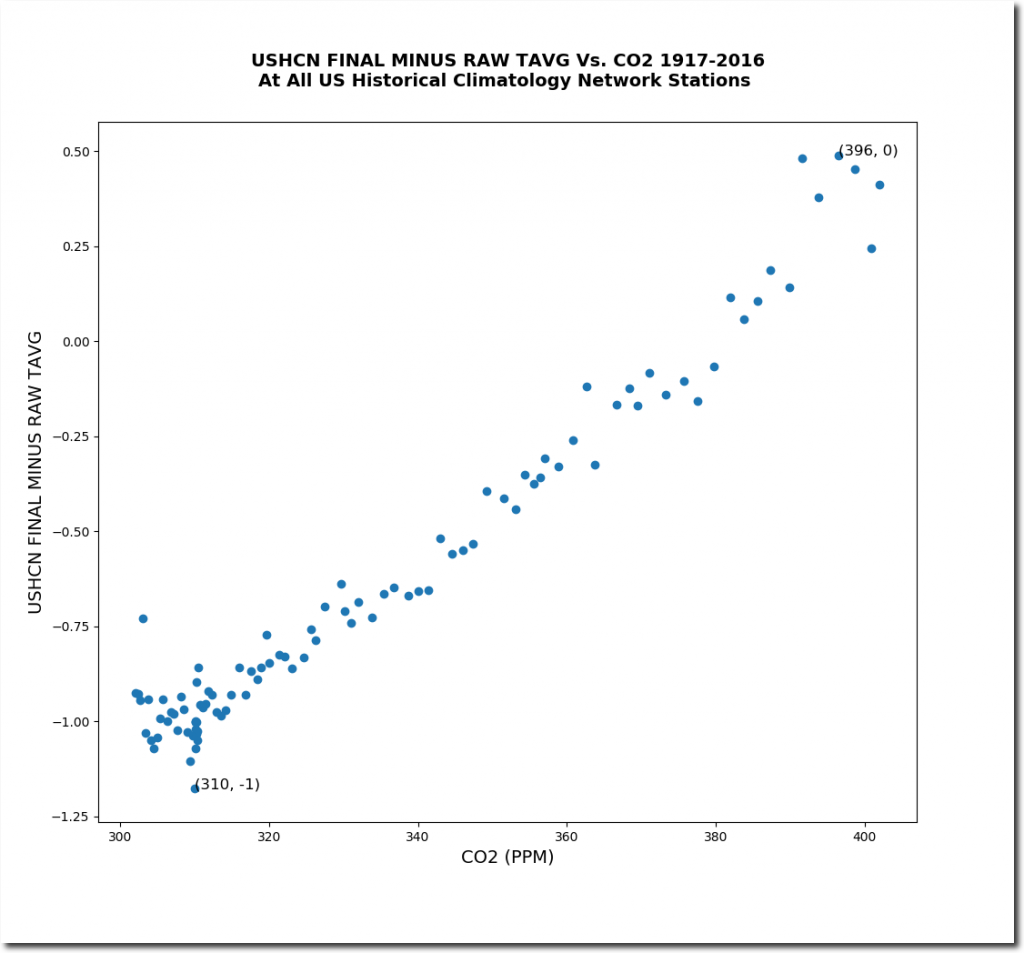
Which is designed to bring the data precisely in line with CO2 theory.
NOAA knows perfectly well that the US is not warming.
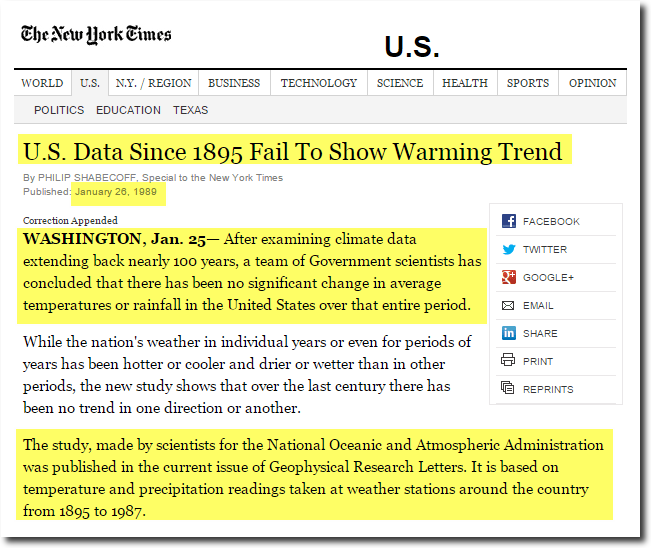
U.S. Data Since 1895 Fail To Show Warming Trend – NYTimes.com
US and global temperatures are constantly being tampered with to cool the past and warm the present.
US tampering :
Global tampering :
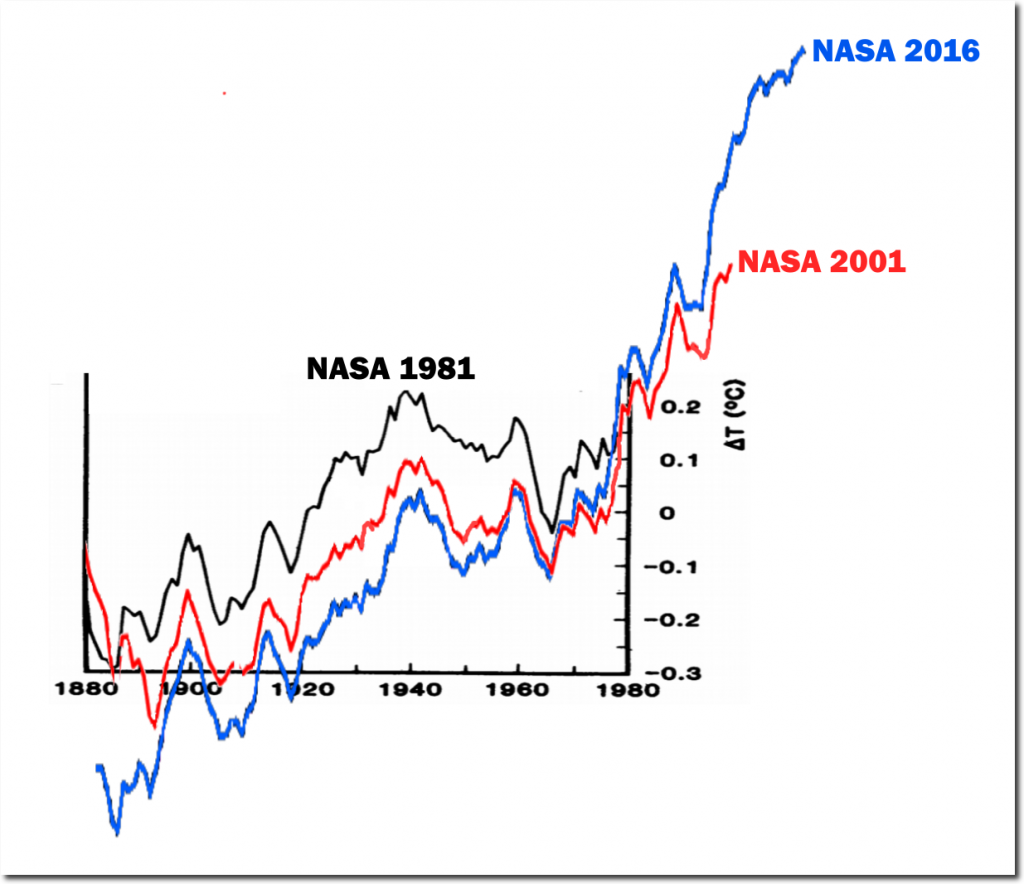
1981: Challenge_chapter2.pdf 2001: Fig.A.ps current: Fig.A.gif
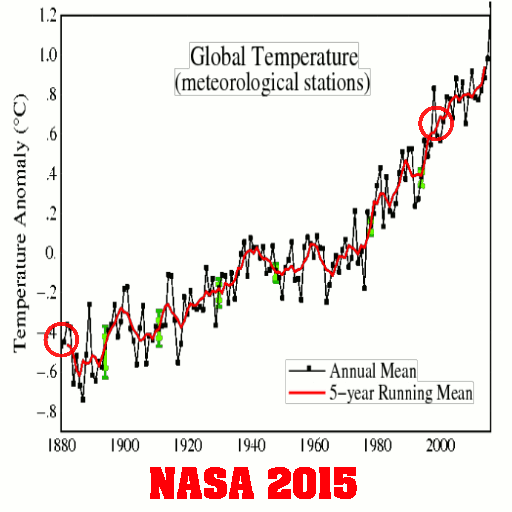
2001 version : Fig.A.ps 2015 version: Fig.A.gif
All of the claims in the National Climate Assessment about global warming are unsupportable junk science, made largely with fraudulent or imaginary data. Global warming is the biggest scam in science history. It has been thoroughly corrupted by tens of billions of dollars of government money – which fake climate scientists refuse to let go of.
The only thing global and unambiguous in the National Climate Assessment, is the level of junk science and fraud it represents.
Unambiguous Fraud In The National Climate Assessment | The Deplorable Climate Science Blog
•••
Related :
NASA / NOAA Data Fraud Related :
Brilliant analysis Tony Heller aka Steve Goddard.
And, not to mention that a homeless encampment cooking fire was responsible for the latest Bel Air fire. Yet, California’s “climate ambulance chaser” in chief, governor Jerry Brown instead blamed “climate change” as a “new normal” … apparently an easier problem to address than the state’s chronic homelessness.
Green Jihad
In this video, author and scientist Tony Heller brilliantly debunks ambulance chasing climate scientists who come out of the woodwork every time there is a natural disaster, like wildfires in California. In fact, burn acreage in the US has plummeted over the past 85 years, as CO2 has increased.
View original post
![]()

A new look at the Wind Industry
ex-OSA staffmember works to reform the subject of Scientology
Exegesis Hermeneutics Flux Capacitor of Truthiness
for those who dream of metaphysical crepes
Politische Beiträge und philosophische Essays
FOR 4.5Bn YEARS CLIMATE & TEMPERATURE HAVE CHANGED Without MANKIND'S INPUT! - Driven by The SUN, PLATE TECTONICS & VOLCANIC ACTION but NOT MANKIND
Conservative Christian and Political Opinion Site. exposing corruption in the church and politics.
The Truth Never Dies
Welcome to an expanding worldview
bildende Künstlerin in Baden bei Wien
Wind Turbine Locations, Maps, Lawsuits, Setbacks
unlimited interests - #Love #Earth #community
Organic Gardening tips
Opinions and analysis of everything under the sun.
ICT Marketing & IT Security in Australia
Recent Comments