Posted: February 22, 2019 | Author: Jamie Spry | Filed under: Alarmism Debunked, Climate science, Climategate, Climatism, CO2, Empirical Evidence, Failed Climate Models, Fossil Fuels, Global Temperature, Green New Deal, Satellite Data, State Of The Climate, The Pause | Tags: "The Pause", Climate Change, Climate science, Climategate, coal, Fossil Fuels, Fukushima, Global Temperature, Global Warming, Global Warming Hiatus, Green New Deal, HELE, Japan, Japan Meteorological Agency (JMA), JMA, Prime Minister Shinzō Abe, Satellite Data, Ultra-Supercritical Coal Power Plant, Vijay Jayaraj, warming pause |

Sushi, Sake, and Coal: Japan’s Peculiar Response to the Climate Conundrum » BarbWire
“The fact is that we can’t account for the lack of warming
at the moment and it is a travesty that we can’t.”
– Kevin Trenberth, National Center For Atmospheric Research, USA (2009)
“Observations do not show rising temperatures throughout the
tropical troposphere … This is just downright dangerous.”
– Peter Thorne, Hadley Centre, Met Office, UK (2007)
***
THE Japanese government has identified and acknowledged the current ~20 year-long global warming “pause” or “hiatus”. The (inconvenient) atmospheric phenomenon that has been the subject of much research and debate in peer-reviewed scientific journals for many years now.
BASED on data from the Japan Meteorological Agency (JMA), the government has justified the expansion of its global-leading, ultra-supercritical HELE coal-fired power plant technology both domestically and abroad.
PRIME MINISTER Abe has sanctioned the addition of 35 new coal power plants to the 100 currently operational.
“Japan’s use of coal is not justified exclusively on the basis of the country’s nuclear debacle. The heart of the reason is Japan’s climate.
For the past three decades, there has been no significant warming in its major cities.”
*
CLIMATE Scientist Vijay Jayaraj reports (Climatism attachments, bolds added) :
Sushi, Sake, and Coal: Japan’s Peculiar Response to the Climate Conundrum
We all know that the Japanese love their sushi. Japan is also famous for sake, a rice wine unique to the country. Lately, the Japanese have shown unrestrained love for a commodity that is increasingly demonized by climate groups: coal.
Global warming alarmists blame coal for causing dangerous global warming. But the Japanese beg to differ. They have revived their love affair with coal. Why? That’s an interesting story.
Soon after the Fukushima nuclear incident, public sentiment towards nuclear energy became hostile. Many organizations, including foreign non-profits, called for the closure of nuclear plants on fears of future mishaps.
The Fukushima plant was outdated and less safe than Japan’s other, modern nuclear plants. Yet, the impact of the Fukushima disaster (in which no one died from radiation exposure) remains fresh in people’s minds, and the nation was not ready to defend the operations of other nuclear plants.
The Japanese government caved in to the pressure and closed many nuclear plants. By 27 March 2012, Japan had only one out of 54 nuclear reactors operating. As a result, the country was forced to seek alternative sources of energy generation.
The Japanese understood that renewable sources like wind and solar could not provide stable and affordable electricity, at least not in the magnitude necessary to meet peak energy demands of Japan’s power-guzzling cities.
The most economical and safe solution was coal. Contrary to popular belief and the mainstream media, coal is not as polluting as you might think.
Moreover, coal is a tried and tested source of energy, guaranteeing superior-quality, stable output to meet the energy demands of modern cities and industries.
With the development of “clean coal technology,” coal combustion now results in fewer contaminants and more energy, making it far superior to the combustion plants of previous decades.
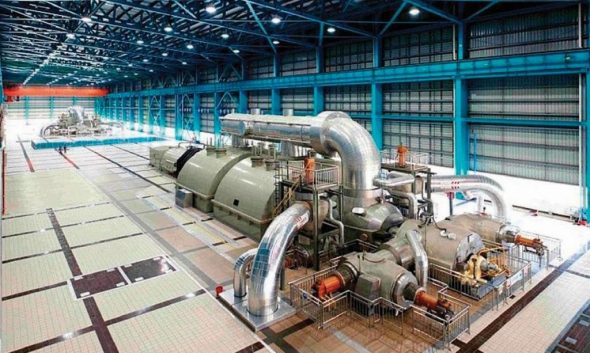
HELE (High Energy Low Emissions) Ultra-Supercritical Coal Power Plant
So, Japan went against the tide and embraced coal with both arms.
It now employs the most advanced and safest coal combustion technology available on the planet, becoming a leading manufacturer and exporter of clean coal technology.
But Japan’s use of coal is not justified exclusively on the basis of the country’s nuclear debacle. The heart of the reason is Japan’s climate.
For the past three decades, there has been no significant warming in its major cities.
Data from the Japan Meteorological Agency (JMA) clearly indicates that there has been no significant deviation in the monthly average temperature between 1998 and 2018. The period between is of special importance to the Japanese government.
As per the climate doomsday theorists, temperatures should have displayed a strong warming trend as the manmade carbon dioxide emissions increased exponentially.
But the temperature levels failed to display any warming trend. That flies in the face of the notion that atmospheric carbon dioxide concentration levels control temperature over the island nation—or, for that matter, the world.
Last week, Sapporo recorded its coldest day in 40 years. In fact, winter in Japan had no warming trend from 1986 to 2018, with the January monthly mean temperature anomalies displaying a cooling trend. If anything, there has been a cooling trend in Japan between 1998 and 2018.
So, the reason for Japanese embrace of coal is pretty clear: no significant warming, coupled with the post-Fukushima anti-nuclear hysteria.
No country would want to reduce its emissions when its monthly average temperatures are actually decreasing. It is for this reason that Japanese Prime Minister Shinzō Abe refuses to stay true to the hasty anti-coal commitments he made at the UN’s international climate summits.
Instead of discouraging the use of coal, Japan is increasing its dependency on coal. Abe has sanctioned the addition of 35 new coal power plants to the 100 currently operational. The country is also encouraging its Asian neighbors and other developing countries to purchase its clean coal technology.
The Japanese response to the anti-coal establishment, besides being bold, accurately reflects climate reality. Japan understands the need to prioritize the domestic energy needs over faulty, pseudo-scientific forecasts of climate doom.
The lack of warming, however, is not limited to Japan. Satellite temperature measurements (between 1979 and January 2019) show no significant warming in the earth’s atmosphere during the past 19 years.
Other countries should emulate Japan’s example, especially in the developing world. Domestic energy needs are far too important to be slain on the altar of global warming hysteria.
Sushi, Sake, and Coal: Japan’s Peculiar Response to the Climate Conundrum » BarbWire

Vijay Jayaraj (M.Sc., Environmental Science, University of East Anglia, England), is Research Associate for and Contributor for Developing Countries, for the Cornwall Alliance for the Stewardship of Creation. He lives in Chennai, India.
FOLLOW Vijay on Twitter : @vjxxvj
***
REFRESHING to see government energy policy being driven by empirical evidence and real-world data, and NOT by fear, hysteria, mainstream media climate change advocacy and alarmism or politically-driven, CO2-centric, UN IPCC climate models.
BRAVO Japan for standing up to the climate groupthink bullies and misanthropic eco-activists. Instead, supporting their industry and citizens by providing them with cheap, abundant and clean (HELE) coal-fired power technology to advance and maintain their world-renowned pristine environment, civic cleanliness, health and wealth!
“The Japanese response to the anti-coal establishment, besides being bold, accurately reflects climate reality. Japan understands the need to prioritize the domestic energy needs over faulty, pseudo-scientific forecasts of climate doom.”
***
PIC of Kinkaku-ji Palace Kyoto from my recent family trip to ‘pristine’ HELE powered Japan!
IF you haven’t been to Japan – GO! Incredible people, culture and country…
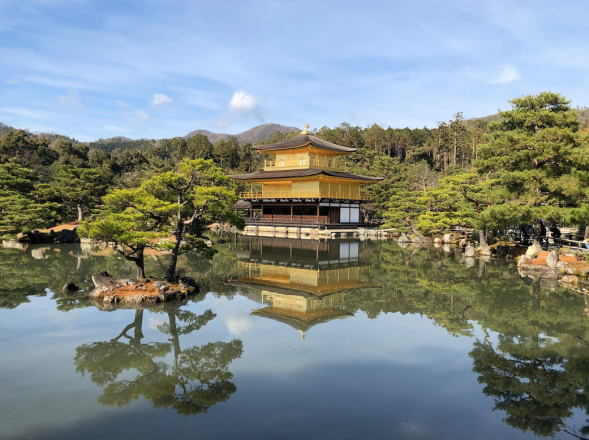
Jamie Japan Trip – Kinkaku-ji Royal Palace Kyoto – Jan 2019 (iPhone 8 – No filter!)
•••
SEE also :
Read the rest of this entry »
Like this:
Like Loading...
Posted: June 20, 2018 | Author: Jamie Spry | Filed under: Australia, Carbon Dioxide, Climatism, CO2, Empirical Evidence, Fact Check, Global Temperature, Global Warming Stasis, Satellite Data, The Pause, UAH, UHI | Tags: "The Pause", Australia, carbon dioxide emissions, climate, Climate Change, Climatism, CO2 Sensitivity, ECS, GHCN, Global Temperature, Global Warming, Global Warming Hiatus, nasa, nature, NOAA, Satellite Data, science, UAH satellite data, UHI, Urban Heat Island effect |
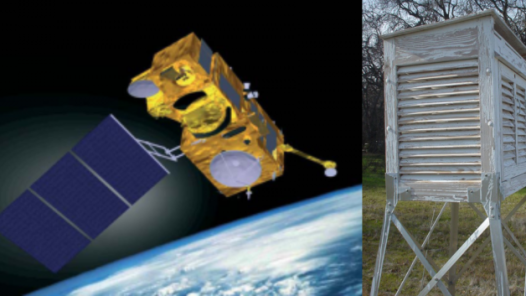
NASA’s MSU satellite measurement systems, generate the RSS and UAH datasets, which measure the average temperature of every cubic inch of the lower atmosphere (0-10 kms), which happens to be the exact place where anthropogenic global warming is meant to occur, according to anthropogenic global warming theory.
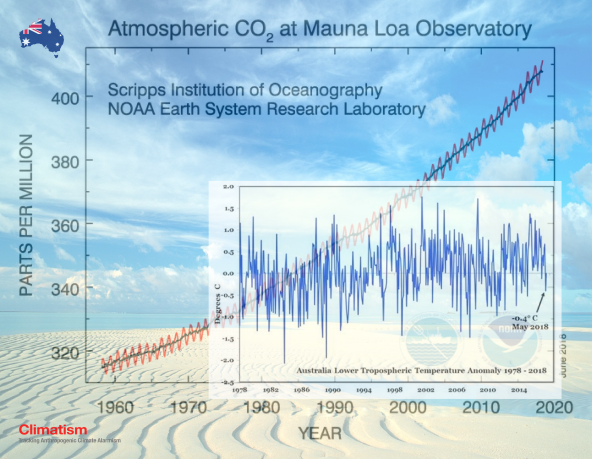
AUS MAY TEMPS -0.4C BELOW AVERAGE
UAH temperature anomaly for May was almost half a degree centigrade (-0.4C) below the 4o year average!

AUSTRALIA Lower Troposheric Temperature Anomaly 1978-2018
SATELLITES have the obvious benefit of measuring only the atmosphere and the effect that carbon dioxide emissions may be having on the atmosphere. Satellite data is not polluted by UHI (Urban Heat Island effect) – artificial heat generated from city infrastructure; asphalt carparks, airpots, highways, AC vents etc.
TONY Heller did a survey of the ten oldest stations in New South Wales And Victoria, circled below. Three rural stations were not included because of obvious problems with the data, but none showed any warming:

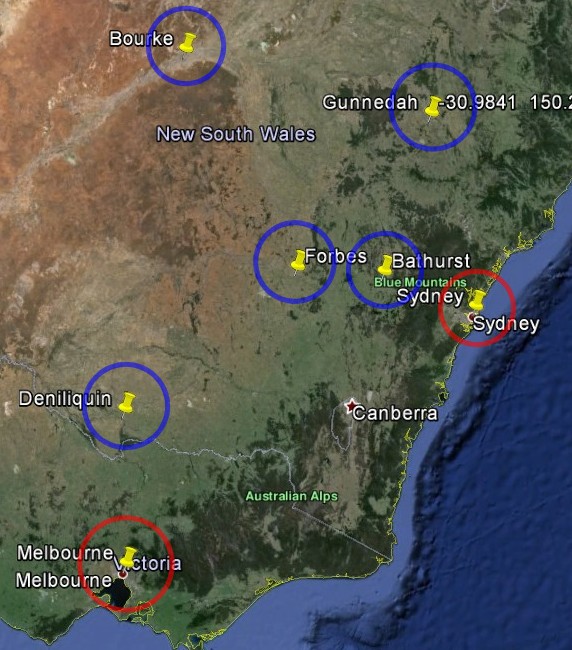
The two urban stations at Melbourne and Sydney both showed strong warming, and both have disastrously poor siting of their thermometers in the middle of large cities.

Melbourne Temperature Anomaly
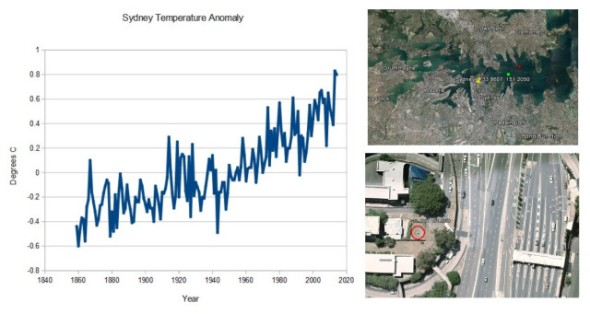
Sydney Temperature Anomaly
By contrast, all of the rural stations show a long term cooling trend, with some recent warming. (Note that there is no data for the most recent years with some of the rural stations.)
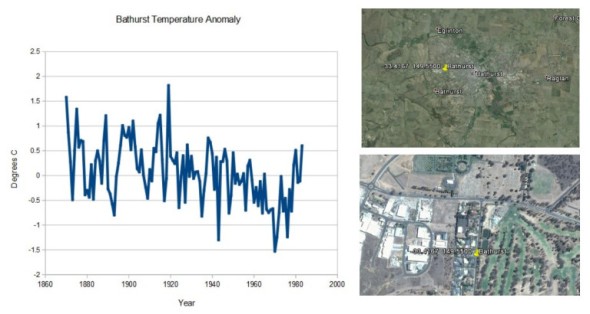
Bathurst Temperature Anomaly
Read the rest of this entry »
Like this:
Like Loading...
Posted: June 6, 2018 | Author: Jamie Spry | Filed under: Carbon Dioxide, Climate Fraud, Climatism, Data Tampering, Empirical Evidence, Gavin Schmidt, Global Temperature, Global Warming Stasis, Government Grants/Funding, Govt Climate Agenda, Green Agenda, NASA, NOAA, Pseudo-Science, Satellite Data | Tags: "The Pause", carbon dioxide emissions, Carbon Emissions, Climate Change, Climate Change Hoax, climate fraud, Climate science, Climatism, CO2, Data Fraud, Gavin Schmidt, GISS, global cooling, Global Warming, Global Warming Hiatus, Global Warming Hoax, Global Warming Scare, nasa, NOAA, Scientific Fraud, Temperature Data Fraud, warming pause |
ACCORDING to NASA data, the recent 0.56°C plunge in global temperatures, following the 2015/16 super El Niño, is the greatest two-year cooling event in a century. “You have to go back to 1982-84 for the next biggest two-year drop, 0.47°C—also during the global warming era.”
NASA’s MSU satellite measurement systems, generate the RSS and UAH datasets, which measure the average temperature of every cubic inch of the lower atmosphere (0-10 kms), the exact place where global warming theory is meant to occur.
MAY TEMPS +0.18C ABOVE AVERAGE
GLOBAL temps continue their cooling trend, rebounding off the 2015/16 Super El Niño – the strongest since accurate measurements began, caused by surface waters in the Pacific Ocean, west of Central America rising up to 3C warmer than usual.
GREENHOUSE GAS THEORY CHECK?
THE latest UAH V6.0 May anomaly of +0.18 brings temperatures back to the levels they were at the beginning of the Century, reinforcing the current 18+ year global warming “pause”, despite record and rising CO2 emissions…
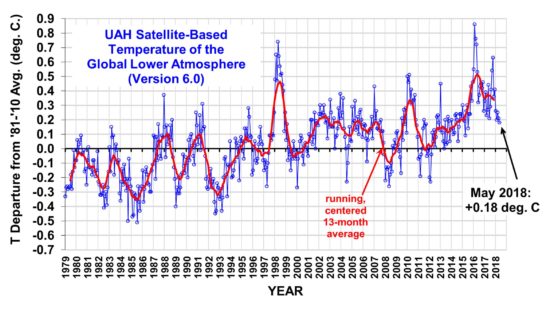
UAH Global Temperature Update for May, 2018- +0.18 deg. C « Roy Spencer, PhD
Latest Global Average Tropospheric Temperatures
Since 1979, NOAA satellites have been carrying instruments which measure the natural microwave thermal emissions from oxygen in the atmosphere. The intensity of the signals these microwave radiometers measure at different microwave frequencies is directly proportional to the temperature of different, deep layers of the atmosphere. Every month, John Christy and I update global temperature datasets that represent the piecing together of the temperature data from a total of fifteen instruments flying on different satellites over the years. A discussion of the latest version (6.0) of the dataset is located here.
The graph above represents the latest update; updates are usually made within the first week of every month. Contrary to some reports, the satellite measurements are not calibrated in any way with the global surface-based thermometer records of temperature. They instead use their own on-board precision redundant platinum resistance thermometers (PRTs) calibrated to a laboratory reference standard before launch.
Latest Global Temps « Roy Spencer, PhD
CO2 CONCENTRATION Vs TEMPS – Correlation?
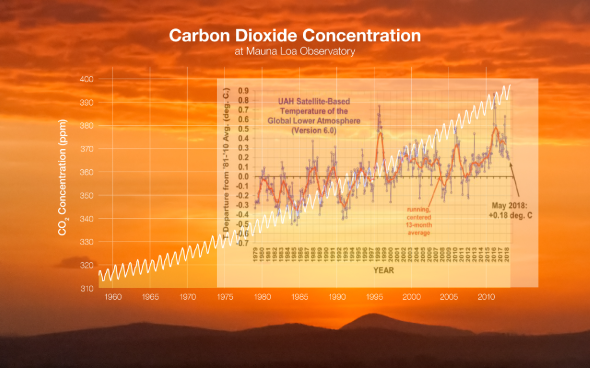
CO2 Vs Temp Correlation 1979-2018 CLIMATISM
*
GLOBAL TEMPERATURE MEASUREMENTS – JUDGE FOR YOURSELF!
Satellites Vs Thermometers?
*
SATELLITES
NASA’s MSU satellite measurement systems, generate the RSS and UAH datasets, which measure the average temperature of every cubic inch of the lower atmosphere, the exact place where global warming theory is meant to occur. Read the rest of this entry »
Like this:
Like Loading...
Posted: January 27, 2018 | Author: Jamie Spry | Filed under: Alarmism Debunked, Carbon Dioxide, Climatism, Consensus, Empirical Evidence, Extreme Weather, Fact Check, Global Warming Stasis, Pseudo-Science, Scientific Fraud, Sea Level Rise, UN, UNEP, UNFCCC | Tags: "The Pause", BoM, Climate Change, Climate Change Hoax, climate fraud, Climate science, Consensus, CSIRO, Davos, Global Warming, Global Warming Hoax, nasa, NOAA, pseudoscience, Scientific Fraud, Settled Science, UN, UNEP |

WITHOUT a shadow of a doubt, the greatest scientific hoax ever perpetrated against mankind is that human’s modern life (including your sandwich) is causing catastrophic “climate change” or “global warming” or “climate disruption” or “climate breakdown”, depending on the day and the activist concerned.
THIS must watch 5 minute video, backed up by peer-reviewed-scientific-evidence and verifiable government data, exposes the climate fraud rather masterfully…
Top 10 Climate Change Lies Exposed – YouTube
- Scientific Sources – Global Warmth
•••
Related :
- CLIMATE CHANGE – The Most Massive Scientific Fraud In Human History | Climatism
- “In Searching For A New Enemy To Unite Us, We Came Up With The Threat Of Global Warming” | Climatism
- Global Warming Is The Greatest And Most Successful Pseudoscientific Fraud In History | Climatism
- EXTREME WEATHER Propaganda – The Pathway To Global Warming Hysteria | Climatism
- NASA “Sea Level Rise” Fraud | Climatism
- Understanding The “Hottest Year Evah” | Climatism
Like this:
Like Loading...
Posted: November 23, 2017 | Author: Jamie Spry | Filed under: Alarmist media, Climate models, Climatism, Dud predictions, Empirical Evidence, Fact Check, Failed Climate Models, Global Temperature, Green Agenda, IPCC, NASA, NOAA, The Pause | Tags: "The Pause", auspol, Climate Change, Climate science, Climatism, COP24, Global Warming, Global Warming "Pause", Global Warming Hiatus, IPCC, nasa, nature, Nature Mag, NOAA, Pal-Review, Peer Review, science, UK Met Office, warming pause |

BETWEEN the start of 1997 and the end of 2014, average global surface temperature stalled. This 18-year period is known as the global warming “pause” or “hiatus” and has been the subject of much research and debate in peer-reviewed scientific journals.
THE rise in global temperatures that alarmed climate campaigners in the 1990’s had slowed so much that the trend was no longer statistically significant. This despite one-third of Man’s entire influence on climate since the Industrial Revolution occurring since February 1997.
THE pause took a pause during the 2015/16 super El Niño which was the strongest such event in recorded history and helped to make 2015 and 2016 the warmest years in the modern warm period. However, 2017 witnessed the biggest drop in global temps in recorded history, seen across most data sets, bringing temps back inline with 1997-2014 averages, rendering “the pause” alive and well, to date.
THERE has been a recent surge in media reports aiming to debunk and bury the inconvenient hiatus, not predicted by any climatologist, science agency, government body, media outlet or UN computer model.
A few of the latest attempts by the mainsteam media at re-writing climate history…
This slideshow requires JavaScript.
BEFORE it “never happened” – established, peer-reviewed climate science was all over the pause.
IN fact, before it was disappeared, the hiatus was central to the IPCC report…

Global warming pause ‘central’ to IPCC climate report – BBC News
*
THE “PAUSE” TIMELINE
1997 – 2015 TEMPS

No global warming at all for 18 years 9 months – a new record – The Pause lengthens again – just in time for UN Summit in Paris | Climate Depot
*
PEER-REVIEWED PAUSE “SCIENCE”

Climate change: The case of the missing heat : Nature News & Comment

Reconciling anthropogenic climate change with observed temperature 1998–2008 | PNAS

Recent global-warming hiatus tied to equatorial Pacific surface cooling : Nature : Nature Publishing Group

Retrospective prediction of the global warming slowdown in the past decade : Nature Climate Change

Overestimated global warming over the past 20 years : Nature Climate Change : Nature Publishing Group
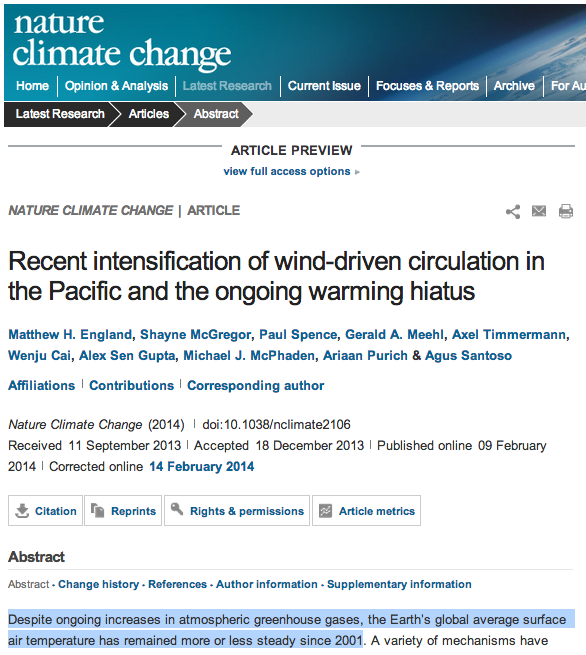
Recent intensification of wind-driven circulation in the Pacific and the ongoing warming hiatus : Nature Climate Change : Nature Publishing Group
Read the rest of this entry »
Like this:
Like Loading...

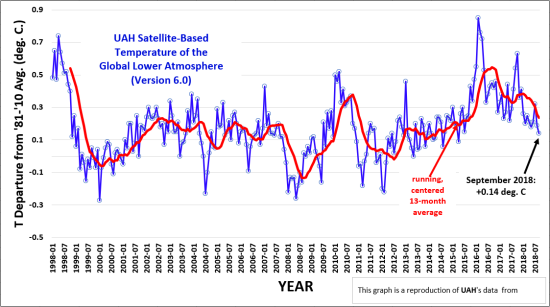


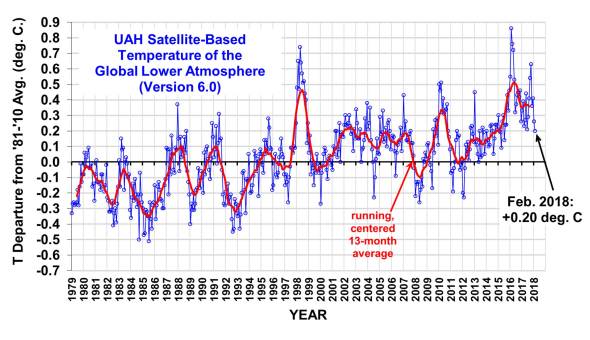
 Global area-averaged lower tropospheric temperature anomalies (departures from 30-year calendar monthly means, 1981-2010). The 13-month centered average is meant to give an indication of the lower frequency variations in the data; the choice of 13 months is somewhat arbitrary… an odd number of months allows centered plotting on months with no time lag between the two plotted time series. The inclusion of two of the same calendar months on the ends of the 13 month averaging period causes no issues with interpretation because the seasonal temperature cycle has been removed as has the distinction between calendar months.
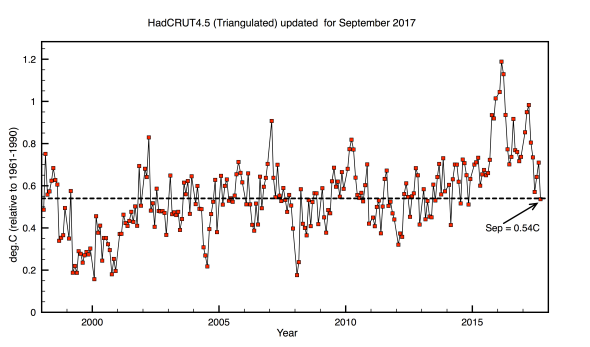 Monthly temperature anomalies for HadCRUT4.5 (HadSST3 and CRUTEM4.6 stations data) calculated by spherical triangulation method. Click for a larger image


Recent Comments