
GLOBAL TEMPERATURE PLUNGE : Coolest September In The Last 10 Years
Posted: October 3, 2018 Filed under: Climatism, Failed Climate Models, Global Cooling, Global Temperature, Grand Solar Minimum, State Of The Climate | Tags: carbon dioxide emissions, Climate Change, Climate science, Climatism, CMIP5, CO2, COP24, ECS, El Nino, failed climate models, Gavin Schmidt, global cooling, Global Temperature, Global Warming, Grand Solar Minimum, La Niña, nasa, NASA GISS, nature, NOAA, RSS, UAH Leave a comment
“We’ve got to ride this global warming issue.
Even if the theory of global warming is wrong,
we will be doing the right thing in terms of
economic and environmental policy.“
– Timothy Wirth,
Fmr President of the UN Foundation
***
GLOBAL atmospheric temperatures continue their rapid decline off the record heights of the 2016 super El Niño, despite record and rising CO2 emissions.
UAH global average lower tropospheric temperature (LT) anomaly for September, 2018 was +0.14°C, down from +0.19°C in August:
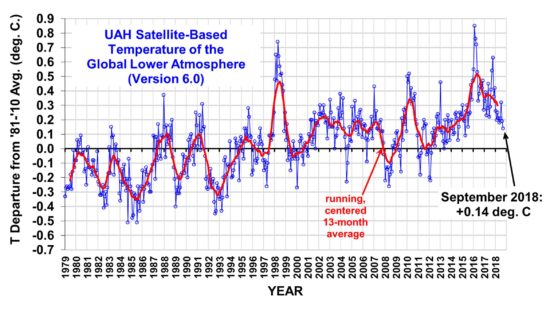
UAH Global Temperature Update for September, 2018: +0.14 deg. C « Roy Spencer, PhD
Latest Global Average Tropospheric Temperatures
Since 1979, NOAA satellites have been carrying instruments which measure the natural microwave thermal emissions from oxygen in the atmosphere. The intensity of the signals these microwave radiometers measure at different microwave frequencies is directly proportional to the temperature of different, deep layers of the atmosphere. Every month, John Christy and I update global temperature datasets that represent the piecing together of the temperature data from a total of fifteen instruments flying on different satellites over the years. A discussion of the latest version (6.0) of the dataset is located here.
The graph above represents the latest update; updates are usually made within the first week of every month. Contrary to some reports, the satellite measurements are not calibrated in any way with the global surface-based thermometer records of temperature. They instead use their own on-board precision redundant platinum resistance thermometers (PRTs) calibrated to a laboratory reference standard before launch.
Latest Global Temps « Roy Spencer, PhD
*
THE September anomaly represents a 0.72°C drop since 2016 super El Niño heights, bringing temps down now to ~1988 levels.
DON’T expect the mainstream media to report in this anytime soon. They are only concerned about hot and climbing temperatures to push their global warming climate change agenda.
*
CO2 CONCENTRATION Vs TEMPS – Correlation?

CO2 Vs Temp Correlation 1979 – SEP 2018 – CLIMATISM
*
GLOBAL TEMPERATURE MEASUREMENTS – You Be The Judge!
Satellites Vs Land-Based Thermometers?

Satellites Vs Thermometers?
SATELLITES
NASA’s MSU satellite measurement systems, generate the RSS and UAH datasets, which measure the average temperature of every cubic inch of the lower atmosphere, the exact place where global warming theory is meant to occur.
BEFORE 2016, UAH and RSS both tracked closely showing very little warming in their data sets which led to the identification and validation of “the pause” in global warming which has since become the subject of much research and debate in peer-reviewed scientific journals.
From the RSS website:
“The simulation as a whole are predicting too much warming” – RSS

Source: http://www.remss.com/research/climate Archived here – http://www.webcitation.org/6fiQcrQDQ
HOWEVER, by 2016, Carl Mears, who is the chief scientist for RSS (Remote Sensing Systems) and who has used the pejorative “denialist” in various correspondence, decided that “the pause” was not a good look for the global warming narrative so RSS was massively adjusted upwards, conveniently eliminating “the pause” in the RSS dataset.
MEARS’ objectivity towards the business of global temperature data collection and reporting can be found in his commentary on his website:

Source: http://www.remss.com/blog/recent-slowing-rise-global-temperatures Archived here: http://www.webcitation.org/6fiS2rI7k
MEARS then published a paper claiming that new and improved adjustments have “found” that missing warming.
Mears, C., and F. Wentz, 2016: Sensitivity of satellite-derived tropospheric
temperature trends to the diurnal cycle adjustment. J. Climate. doi:10.1175/JCLID-
15-0744.1, in press.
http://journals.ametsoc.org/doi/abs/10.1175/JCLI-D-15-0744.1?af=R
THE result…
Differences between the old version and new version of RSS:

Fig. 8. Comparison between RSS V3.3 global (80°S to 80°N) anomaly time series, and result from the V4.0 merging algorithm with different levels of adjustments applied.
(Data via WUWT)
*
UAH NASA SATELLITE (Featured)
UAH Global Temperature Update for September, 2018: +0.14 deg. C « Roy Spencer, PhD
UAH is the satellite data set featured in this post and is jointly run by Dr. John R. Christy – Distinguished Professor of Atmospheric Science and Director of the Earth System Science Center at The University of Alabama in Huntsville. And Roy Spencer Ph.D. Principal Research Scientist at the University of Alabama in Huntsville.
SPENCER commentary on the divergence between RSS and UAH post “adjustment”:
“We have a paper in peer review with extensive satellite dataset comparisons to many balloon datasets and reanalyses. These show that RSS diverges from these and from UAH, showing more warming than the other datasets between 1990 and 2002 – a key period with two older MSU sensors both of which showed signs of spurious warming not yet addressed by RSS. I suspect the next chapter in this saga is that the remaining radiosonde datasets that still do not show substantial warming will be the next to be “adjusted” upward.
The bottom line is that we still trust our methodology. But no satellite dataset is perfect, there are uncertainties in all of the adjustments, as well as legitimate differences of opinion regarding how they should be handled.
Also, as mentioned at the outset, both RSS and UAH lower tropospheric trends are considerably below the average trends from the climate models.
And that is the most important point to be made.”
Comments on the New RSS Lower Tropospheric Temperature Dataset « Roy Spencer, PhD
(Climatism bolds)
* Read the rest of this entry »
“THE PAUSE” Lives On : Global Temperatures Continue To Cool Despite Record And Rising CO2 Emissions
Posted: March 2, 2018 Filed under: Climate Fraud, Climate models, Climatism, Data Tampering, Gavin Schmidt, Global Temperature, Global Warming Stasis, Govt Climate Agenda, Hockey Stick, NASA, NOAA, Satellite Data, The Pause, UAH | Tags: "The Pause", Carl Mears, Climate Change, climate fraud, Climate science, Data Fraud, Data Sets, Data Tampering, Dr Roy Spencer, Earth Sciences, Gavin Schmidt, GISS, GISTEMP, Global Temperature, Global Warming, Global Warming "Pause", Global Warming Hiatus, John Christy, RSS, Satellite Data, UAH Leave a comment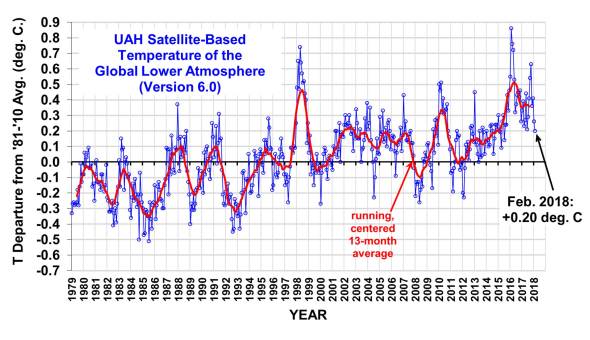
UAH Global Temperature Update for February, 2018: +0.20 deg. C « Roy Spencer, PhD
GLOBAL temps continue their cooling trend, rebounding off the 2015/16 Super El Niño – the strongest since accurate measurements began, caused by surface waters in the Pacific Ocean, west of Central America rising up to 3C warmer than usual.
THE latest UAH V6.0 February anomaly of +0.20 brings temperatures back to the levels they were at after the 1998 El Niño.
UAH Feb data and results here…
*
MEASURING GLOBAL TEMPERATURES – Satellites Vs Thermometers? Read the rest of this entry »
RSS Shows No Warming In Australia
Posted: November 5, 2013 Filed under: Australia, Climate, Climate Change, Empirical Evidence, Fact Check, Global Warming Stasis, Satellite Data | Tags: Australia, Cimate, No Warming, RSS Leave a comment“We’ve got to ride this global warming issue.
Even if the theory of global warming is wrong,
we will be doing the right thing in terms of
economic and environmental policy.“
– Timothy Wirth,
President of the UN Foundation
“No matter if the science of global warming is all phony…
climate change provides the greatest opportunity to
bring about justice and equality in the world.”
– Christine Stewart,
former Canadian Minister of the Environment
“This planet is on course for a catastrophe.
The existence of Life itself is at stake.”
– Dr Tim Flannery,
Principal Research Scientist
“So even the rain that falls isn’t actually going to fill our dams and our river systems, and that’s a real worry for the people in the bush.” –Tim Flannery, (fmr) AU Climate Commissioner
•••
RSS studies the measurements made by 3 series of satellite-borne microwave sounders in order to construct long-term, climate-quality atmospheric temperature readings datasets for use by the scientific community.
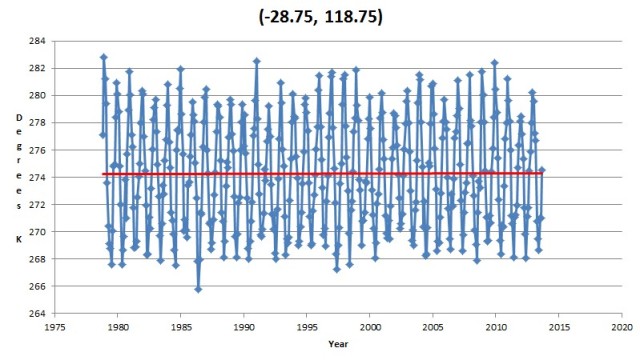
Thousands of measurements from these satellites criss cross the nation day and night covering every corner of the land (unaffected by UHI – Urban Heat Island effect) and this is what they show for Australia’s recent temperature history …
RSS Shows No Warming In Australia :
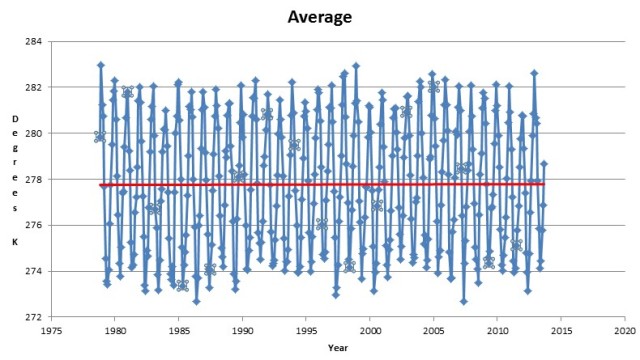
Center of Australia

Southeast Queensland

NT near Gulf of Carpentaria

Northwest WA

Southwest WA
ftp://ftp.remss.com/msu/data/netcdf/rss_tb_maps_ch_tlt_v3_3.nc
Re-Posted from Real Science Posted on November 5, 2013
•••
Australia Climate Related :
- Claim: Humans behind record Australian heat, research shows | CACA
- NATURE STUDY Confirms Global Warming Stopped 15 Years Ago | CACA
- Shock News : Southern Queensland Almost As Warm As 1940 | CACA
- Sydney Almost As Warm As 100 years Ago | CACA
- Australia’s record hottest 12 month period? Junk science say the Satellites | CACA
- Mystery black-box method used to make *all new* Australian “hottest” ever records « JoNova
- Australia’s Angry Hot Summer was hot angry hype– satellites show it was average « JoNova
- Julia Fixed The Climate | Real Science
- NSW Fires : Ashley’s Bushfire Monologue | CACA
- Australia’s Climate Comm: Propaganda Unit Blinded By Ideology | CACA
- Claim: Ocean Acidification Is Climate Change’s ‘Equally Evil Twin’ | CACA
- Shock News : Australia’s Climate Has Never Been Stable | CACA
- Shock News : NSW Fires Have Nothing To Do With Global Warming | CACA
- Sea-level rises are slowing, tidal gauge records show (Sydney) | CACA
- Global Warming Deaths To Quadruple By 2050 | CACA
- Scrap this green energy target. Remove these blights | Herald Sun Andrew Bolt Blog
UNFCCC COP19 Warsaw Climate Conference Related :
- Climate Topics You Won’t Find On The Programme At This Year’s COP19 Jamboree
RSS global temperature data: No global warming at all for 202 months
Posted: September 12, 2013 Filed under: Carbon Dioxide, Empirical Evidence, Global Warming, Satellite Data | Tags: climate, failed models, Global Warming, RSS, Satellite Data Leave a comment‘Where, Oh Where, Has that Global Warming Gone?’ — ‘One highly plausible answer to this mystery is that the climate models upon which IPCC’s failed projections are based exaggerate climate sensitivity to CO², underestimate known natural forcings, and simply don’t understand how to factor in and calibrate other influences such as ocean cycles and solar activity.’

Recent Comments