Posted: June 20, 2018 | Author: Jamie Spry | Filed under: Australia, Carbon Dioxide, Climatism, CO2, Empirical Evidence, Fact Check, Global Temperature, Global Warming Stasis, Satellite Data, The Pause, UAH, UHI | Tags: "The Pause", Australia, carbon dioxide emissions, climate, Climate Change, Climatism, CO2 Sensitivity, ECS, GHCN, Global Temperature, Global Warming, Global Warming Hiatus, nasa, nature, NOAA, Satellite Data, science, UAH satellite data, UHI, Urban Heat Island effect |
NASA’s MSU satellite measurement systems, generate the RSS and UAH datasets, which measure the average temperature of every cubic inch of the lower atmosphere (0-10 kms), which happens to be the exact place where anthropogenic global warming is meant to occur, according to anthropogenic global warming theory.
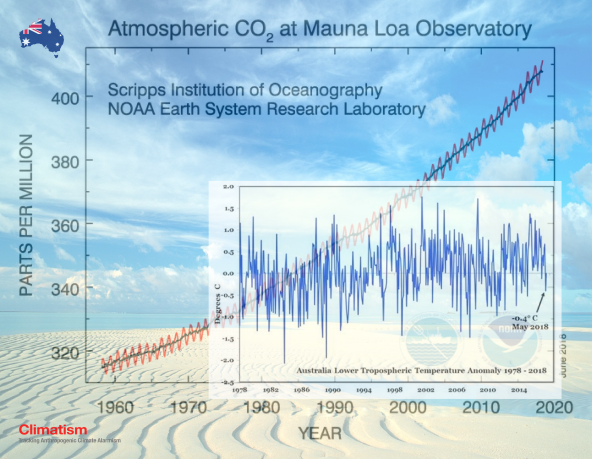
AUS MAY TEMPS -0.4C BELOW AVERAGE
UAH temperature anomaly for May was almost half a degree centigrade (-0.4C) below the 4o year average!

AUSTRALIA Lower Troposheric Temperature Anomaly 1978-2018
SATELLITES have the obvious benefit of measuring only the atmosphere and the effect that carbon dioxide emissions may be having on the atmosphere. Satellite data is not polluted by UHI (Urban Heat Island effect) – artificial heat generated from city infrastructure; asphalt carparks, airpots, highways, AC vents etc.
TONY Heller did a survey of the ten oldest stations in New South Wales And Victoria, circled below. Three rural stations were not included because of obvious problems with the data, but none showed any warming:


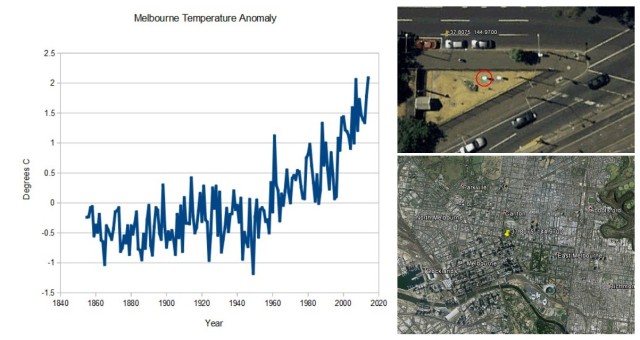
The two urban stations at Melbourne and Sydney both showed strong warming, and both have disastrously poor siting of their thermometers in the middle of large cities.

Melbourne Temperature Anomaly
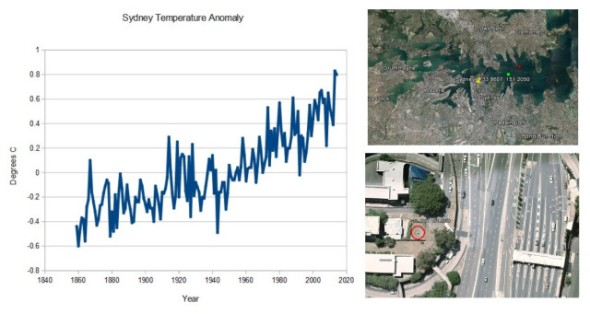
Sydney Temperature Anomaly
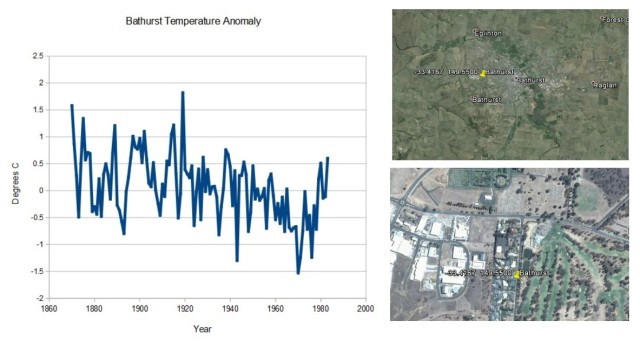
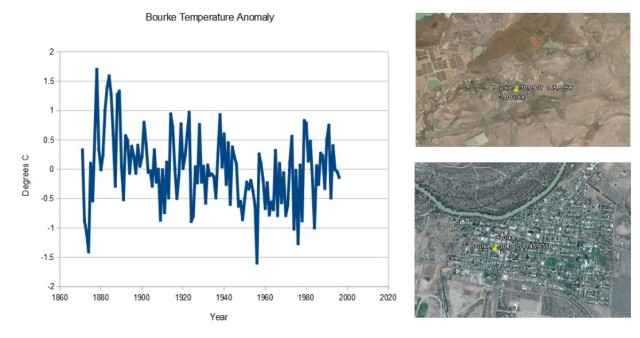
By contrast, all of the rural stations show a long term cooling trend, with some recent warming. (Note that there is no data for the most recent years with some of the rural stations.)
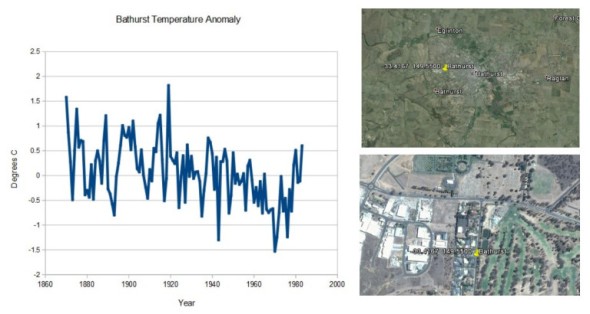
Bathurst Temperature Anomaly
Read the rest of this entry »
Like this:
Like Loading...
Posted: March 2, 2018 | Author: Jamie Spry | Filed under: Climate Fraud, Climate models, Climatism, Data Tampering, Gavin Schmidt, Global Temperature, Global Warming Stasis, Govt Climate Agenda, Hockey Stick, NASA, NOAA, Satellite Data, The Pause, UAH | Tags: "The Pause", Carl Mears, Climate Change, climate fraud, Climate science, Data Fraud, Data Sets, Data Tampering, Dr Roy Spencer, Earth Sciences, Gavin Schmidt, GISS, GISTEMP, Global Temperature, Global Warming, Global Warming "Pause", Global Warming Hiatus, John Christy, RSS, Satellite Data, UAH |
UAH Global Temperature Update for February, 2018: +0.20 deg. C « Roy Spencer, PhD
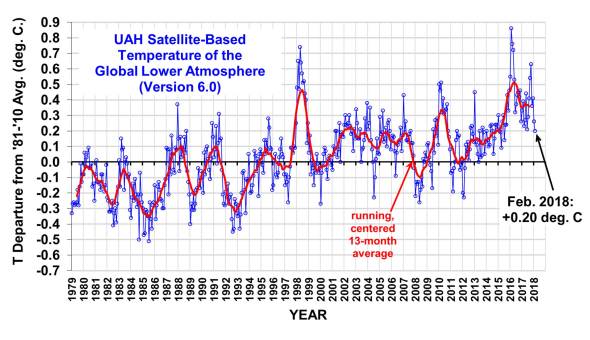
GLOBAL temps continue their cooling trend, rebounding off the 2015/16 Super El Niño – the strongest since accurate measurements began, caused by surface waters in the Pacific Ocean, west of Central America rising up to 3C warmer than usual.
THE latest UAH V6.0 February anomaly of +0.20 brings temperatures back to the levels they were at after the 1998 El Niño.
UAH Feb data and results here…
*
MEASURING GLOBAL TEMPERATURES – Satellites Vs Thermometers? Read the rest of this entry »
Like this:
Like Loading...
Posted: February 2, 2018 | Author: Jamie Spry | Filed under: Climate Change, Failed Climate Models, Global Cooling, Global Temperature, Global Warming Stasis, Satellite Data, UAH | Tags: "The Pause", Carbon Dioxide, Climate Change, Climate Change Scam, global cooling, Global Temperature, Global Warming "Pause", Global Warming Hiatus, Global Warming Scam, Temperature Stasis, The Great Pause, UAH, UAH satellite data |
AND the great global warming “pause” settles back into play!
 Watts Up With That?
From Dr. Roy Spencer:
UAH Global Temperature Update for January, 2018: +0.26 deg. C
Coolest tropics since June, 2012 at -0.12 deg. C.
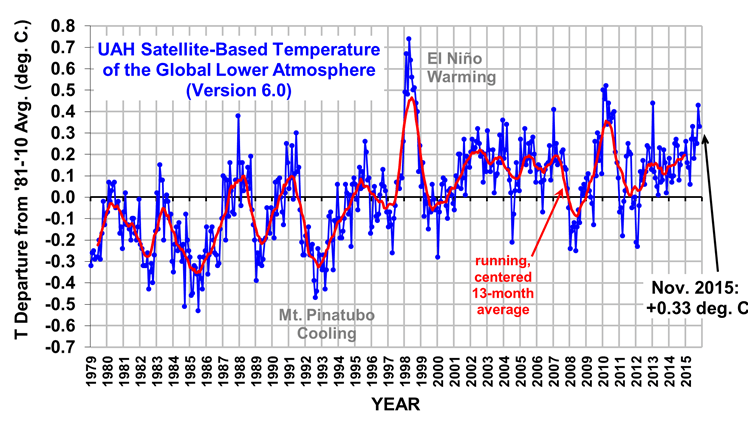
The Version 6.0 global average lower tropospheric temperature (LT) anomaly for January, 2018 was +0.26 deg. C, down from the December, 2017 value of +0.41 deg. C:
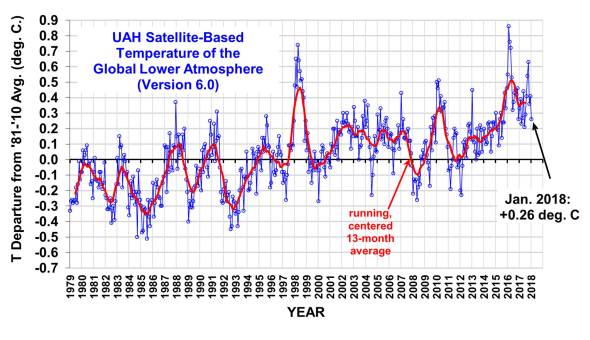 Global area-averaged lower tropospheric temperature anomalies (departures from 30-year calendar monthly means, 1981-2010). The 13-month centered average is meant to give an indication of the lower frequency variations in the data; the choice of 13 months is somewhat arbitrary… an odd number of months allows centered plotting on months with no time lag between the two plotted time series. The inclusion of two of the same calendar months on the ends of the 13 month averaging period causes no issues with interpretation because the seasonal temperature cycle has been removed as has the distinction between calendar months.
The global, hemispheric…
View original post 777 more words
Like this:
Like Loading...
Posted: November 28, 2016 | Author: Jamie Spry | Filed under: Carbon Dioxide, Climate science, Data Tampering, Empirical Evidence, Fact Check, Failed Climate Models, Gavin Schmidt, Global Cooling, Global Temperature, Global Warming Stasis, Global Warming Zealots, NASA, NOAA, Satellite Data, UAH | Tags: El Nino, Gavin Schmidt, GISS, Global Temperature, GWPF, La Niña, nasa, Natural Climate Change, Natural Climate Forcings, RSS Satellite Data, UAH satellite data |
Record Drop In Global Temperatures As El Nino Warming Ends | The Global Warming Policy Forum (GWPF)
The controversial global warming aka climate change “hiatus/pause”, lingering like a bad smell to climate alarmists for nearly two decades, is back in play with a record drop in global temperatures since the middle of the year.
Temperatures are heading south rapidly. The latest huge drop despite record and increasing CO2 emissions.
Must be nearing revision time for the theory of Catastrophic Global Warming with regards to CO2-sensitivity?
•••
Via GWPF :
(Bolds added by Climatism)
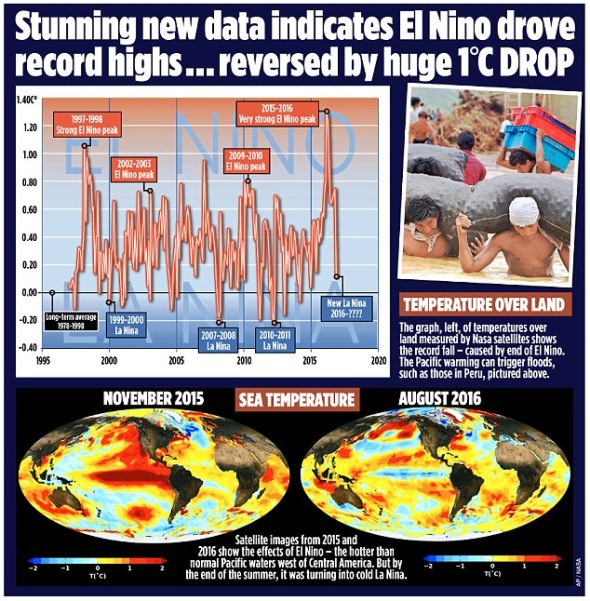
RECORD DROP IN GLOBAL TEMPERATURES AS EL NINO WARMING ENDS
Global average temperatures over land have plummeted by more than 1C since the middle of this year – their biggest and steepest fall on record. According to satellite data, the late 2016 temperatures are returning to the levels they were at after the 1998 El Nino.
The news comes amid mounting evidence that the recent run of world record high temperatures is about to end.
The fall, revealed by Nasa satellite measurements of the lower atmosphere, has been caused by the end of El Nino – the warming of surface waters in a vast area of the Pacific west of Central America.
Some scientists, including Dr Gavin Schmidt, head of Nasa’s climate division, have claimed that the recent highs were mainly the result of long-term global warming.
Others have argued that the records were caused by El Nino, a complex natural phenomenon that takes place every few years, and has nothing to do with greenhouse gas emissions by humans.
The new fall in temperatures suggests they were right.
Big El Ninos always have an immense impact on world weather, triggering higher than normal temperatures over huge swathes of the world. The 2015-16 El Nino was probably the strongest since accurate measurements began, with the water up to 3C warmer than usual.
It has now been replaced by a La Nina event – when the water in the same Pacific region turns colder than normal.
This also has worldwide impacts, driving temperatures down rather than up.
The satellite measurements over land respond quickly to El Nino and La Nina. Temperatures over the sea are also falling, but not as fast, because the sea retains heat for longer.
This means it is possible that by some yardsticks, 2016 will be declared as hot as 2015 or even slightly hotter – because El Nino did not vanish until the middle of the year.
But it is almost certain that next year, large falls will also be measured over the oceans, and by weather station thermometers on the surface of the planet – exactly as happened after the end of the last very strong El Nino in 1998. If so, some experts will be forced to eat their words.
Last year, Dr Schmidt said 2015 would have been a record hot year even without El Nino.
‘The reason why this is such a warm record year is because of the long-term underlying trend, the cumulative effect of the long-term warming trend of our Earth,’ he said. This was ‘mainly caused’ by the emission of greenhouse gases by humans.
Dr Schmidt also denied that there was any ‘pause’ or ‘hiatus’ in global warming between the 1998 and 2015 El Ninos.
But on its website home page yesterday, Nasa featured a new study which said there was a hiatus in global warming before the recent El Nino, and discussed why this was so. Last night Dr Schmidt had not returned a request for comment.
However, both his own position, and his Nasa division, may be in jeopardy. US President-elect Donald Trump is an avowed climate change sceptic, who once claimed it was a hoax invented by China.
Last week, Mr Trump’s science adviser Bob Walker said he was likely to axe Nasa’s $1.9 billion (about £1.4 billion) climate research budget.
Other experts have also disputed Dr Schmidt’s claims. Professor Judith Curry, of the Georgia Institute of Technology, and president of the Climate Forecast Applications Network, said yesterday: ‘I disagree with Gavin. The record warm years of 2015 and 2016 were primarily caused by the super El Nino.’
The slowdown in warming was, she added, real, and all the evidence suggested that since 1998, the rate of global warming has been much slower than predicted by computer models – about 1C per century.
David Whitehouse, a scientist who works with Lord Lawson’s sceptic Global Warming Policy Foundation, said the massive fall in temperatures following the end of El Nino meant the warming hiatus or slowdown may be coming back.
‘According to the satellites, the late 2016 temperatures are returning to the levels they were at after the 1998 El Nino.
The data clearly shows El Nino for what it was – a short-term weather event,’ he said.
Record Drop In Global Temperatures As El Nino Warming Ends | The Global Warming Policy Forum (GWPF)
•••
NASA and NOAA will be tweaking their heads and data-sets overtime in order to declare 2016 as “The Hottest Year Evah”. Possibly too late in the year to wipe out this years “Super El niño”.
•••
UPDATE
Further analysis from Paul Homewood’s excellent site Not A Lot Of People Know That :
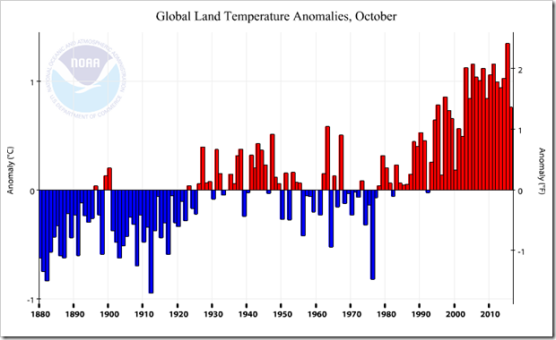
Rose uses satellite data for his graph, but the NOAA surface data for land also gives a stark picture:
Climate at a Glance | National Centers for Environmental Information (NCEI)
Even NOAA admit that October was by far the coldest over land since 2001, despite the fact that are we still awaiting the start of La Nina.
It is also becoming increasingly apparent that this year’s El Nino event is the strongest one at least for the last 60 years, more powerful than 1983/3 and 1997/8.
Whilst it has not peaked quite as high, it has been much more longer lasting.
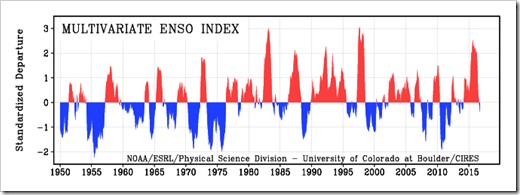
Earth System Research Laboratory : PSD : (none)
Global Land Temperatures Plummet In October | NOT A LOT OF PEOPLE KNOW THAT
Related :
- Spectacular Drop In Global Average Satellite Temperatures | Climatism
- Understanding The “Hottest Year Evah” | Climatism (NASA Temperature Fraud)
- Establishing Propaganda Is Vital For Climate Action | Climatism (Peer-Reviewed “Pause” Papers via NatureMag)
- Climate Models Don’t Work | Climatism
Like this:
Like Loading...
Posted: September 8, 2016 | Author: Jamie Spry | Filed under: Climate Fraud, Climatism, Data Tampering, Empirical Evidence, Environmentalists, Fact Check, Gavin Schmidt, Global Temperature, Govt Climate Agenda, Green Agenda, Satellite Data, Scientific Fraud, UAH | Tags: Climate Change Scam, climate fraud, Data Fraud, Data Tampering, Fact Check, Gavin Schmidt, Global Warming, nasa, NOAA, RSS Satellite Data, Satellite Data, UAH satellite data, UHI |
“I believe it is appropriate to have an ‘over-representation’ of the facts
on how dangerous it is, as a predicate for opening up the audience.”
– Al Gore,
Climate Change activist
“No matter if the science of global warming is all phony…
climate change provides the greatest opportunity to
bring about justice and equality in the world.”
– Christine Stewart,
former Canadian Minister of the Environment
“We’ve got to ride this global warming issue.
Even if the theory of global warming is wrong,
we will be doing the right thing in terms of
economic and environmental policy.“
– Timothy Wirth,
President of the UN Foundation
“The Earth has cancer
and the cancer is Man.”
– Club of Rome,
premier environmental think-tank,
consultants to the United Nations

Global Warming activists routinely parrot the infamous “Hottest Year Ever” meme.
However, this depends entirely on which temperature data set is cited:
NASA’s ‘GISS’ temp uses land and ocean-based thermometers which measure “different parts of the system [UHI affected parking lots, asphalt heat sinks, AC exhaust air vents], different signal to noise ratio [we bias toward warm stations], different structural uncertainty [we ‘homogenise’ our data set to cool the past and warm the present to fit the global warming narrative].” – NASA GISS Gavin Schmidt’s admission about the satellite record versus the surface temperature record (square bracket add-ons by Climatism)
Then there are the much more accurate and comprehensive satellite measurement systems, RSS/UAH, which measure 24/7 the average temperature of every cubic inch of the lower troposphere – the exact place where global warming is meant to occur, according to the theory.
There is a growing divergence between NASA’s (land-based) GISS temp and RSS (lower troposphere) satellite temps since 2000:

Gavin’s New Site | Real Science
The growing divergence between NASA’s GISS and RSS satellite data sets, since 2000, didn’t used to be so stark.
So why the obvious temp divergence, post 2000, after near exact correlation from 1979?
Before 2016 El Niño :

Wood for Trees: Interactive Graphs
Current RSS v GISS :

Wood for Trees: Interactive Graphs
Tony Heller of Real Climate Science, amongst many other heroic climate realists, have spent thousands of unpaid hours explaining why NASA’s data set has been corrupted by 1. UHI and 2. ‘Cooling the past and warming the present.'(data manipulation) to fit the global warming narrative.
UHI (Urban Heat Island effect):
All Warming In NSW And Victoria Is Due To UHI
Posted on October 11, 2014 by stevengoddard
I did a survey of the ten oldest stations in New South Wales And Victoria, circled below. Three rural stations were not included because of obvious problems with the data, but none showed any warming.
MELBOURNE REGIONAL OFFICE              ASN00086071
DENILIQUIN (WILKINSON ST)              ASN00074128
BATHURST GAOL                          ASN00063004
SYDNEY (OBSERVATORY HILL)              ASN00066062
CAPE OTWAY LIGHTHOUSE          GSN     ASN00090015
BOURKE POST OFFICE                     ASN00048013
WAGGA WAGGA (KOORINGAL)                ASN00072151
FORBES (CAMP STREET)                   ASN00065016
INVERELL COMPARISON                    ASN00056017
GUNNEDAH POOL                          ASN00055023
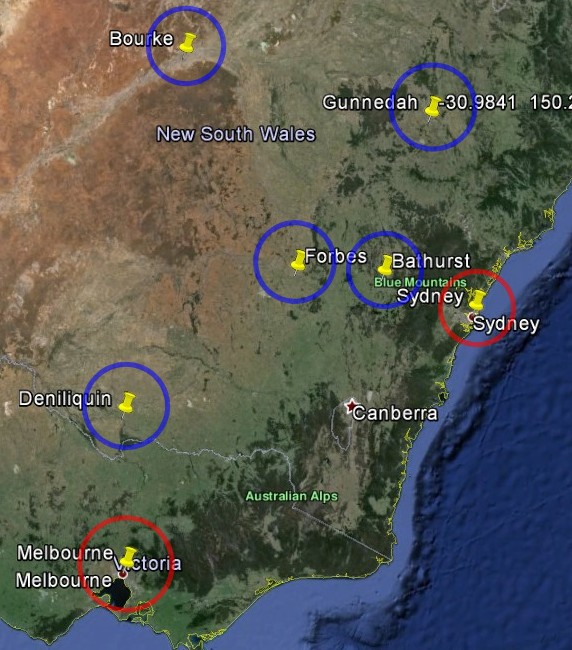
The two urban stations at Melbourne and Sydney both showed strong warming, and both have disastrously poor siting of their thermometers in the middle of large cities.

By contrast, all of the rural stations show a long term cooling trend, with some recent warming. (Note that there is no data for the most recent years with some of the rural stations.)

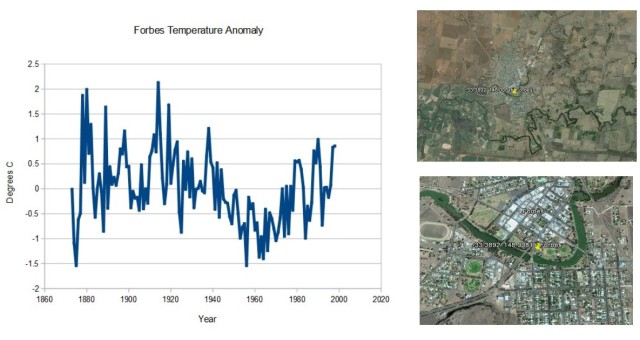
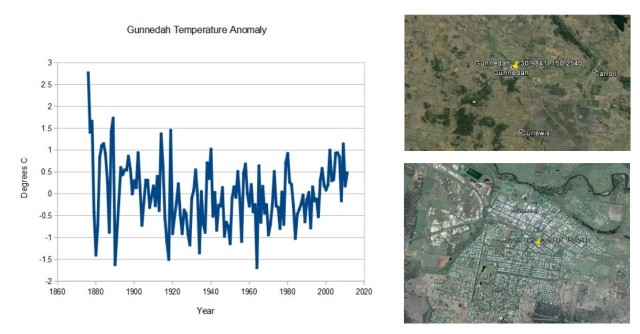
The only conclusion which can be derived from this is that Australia has not warmed long-term, and that BOM claims of record temperatures are due to UHI and/or data tampering.
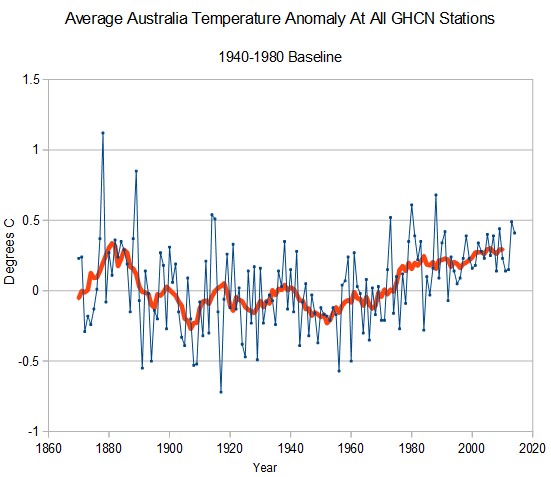
For all GHCN stations in Australia, there is no net warming since 1880
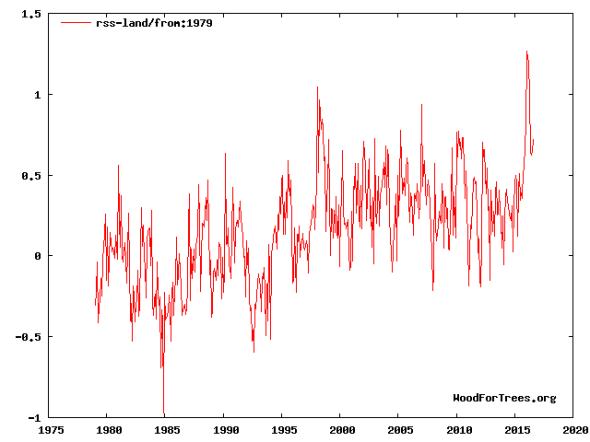
RSS shows no warming in Australia on average since 1979 :

RSS Shows No Warming In Australia | Climatism
Satellites temperature measurement systems, UAH/RSS, are not polluted with asphalt, car parks, AC exhausts or human development, which is probably why they show no statistically significant global warming, at all, for nearly two decades :

LATEST GLOBAL TEMPS – UAH SATELLITE – ROY SPENCER – Latest Global Temps « Roy Spencer, PhD
Wood for Trees: Interactive Graphs
UPDATE April, 2 2017
Current RSS Satellite temp data…
(Note record temp drop post 2016 El nino. Confirmed by UK Met office.)

Wood for Trees: Interactive Graphs
On the other hand, NASA’s climate change activist-in-chief, Gavin Schmidt’s GISS temp measures; asphalt, car parks, AC exhausts and human development :
From WUWT :
From the “global warming data looks better with heat-sinks and air conditioners” department.
Dr. Mark Albright, of the University of Washington writes:
Here is a great example of how NOT to measure the climate! On our way back to Tucson from Phoenix on Monday we stopped by to see the Picacho 8 SE coop site at Picacho Peak State Park. Note the white MMTS temperature monitor 1/3 of the way in from the left. The building is surrounded by the natural terrain of the Sonoran Desert, but instead the worst possible site adjacent to the paved road and SW facing brick wall was chosen in 2009 as the location to monitor temperature.
Here is a view looking Northeast:

For an aerial view in google maps:
https://www.google.com/maps/place/32°38’45.9%22N+111°24’06.9%22W/@32.6461088,-111.4018201,111m/data=!3m1!1e3!4m2!3m1!1s0x0:0x0?hl=en
The NCEI HOMR metadata repository tells us:
COMPATABLE EQUIPMENT MOVE 55 FEET DUE WEST. EQUIPMENT MOVED 05/06/2009. (that is when the new state park visitor center was built)
http://www.ncdc.noaa.gov/homr/#ncdcstnid=20001376&tab=MISC
Additional photos:

Note the air conditioner heat exchangers within a few feet of the MMTS sensor:


Picacho 8 SE has it all: brick building, parking lot, road, and air conditioner heat exchangers within a few feet of the MMTS sensor.
This one takes the cake, and I think it is worse than our former worst-case USHCN station (now closed) located in a parking lot in Tucson at the University of Arizona:

•••
And here’s the resulting UHI-polluted graph from NASA :

Data.GISS: GISS Surface Temperature Analysis: Analysis Graphs and Plots
•••
Outside of how to accurately measure the earth’s atmosphere to detect the supposed anthropogenic global warming signal, there is a mountain of damning evidence relating to the fraudulent tampering of the global temperature record by climate activist government agencies – NASA and NOAA.
I highly recommend visiting Tony Heller’s site “Real Climate Science” for a comprehensive understanding of the blatant manipulation of NASA’s GISS temp data set to fit the global warming narrative.
Some examples via Tony Heller of NASA ‘cooling the past and warming the present’:
NASA has massively altered their global temperature data over the past 15 years, to double global warming:

A Closer Look At GISS Temperature Fraud | Real Science
The animated image below shows the changes which Dr. Hansen made to the historical US temperature record after the year 1999. He cooled the 1930s, and warmed the 1980s and 1990s. The year 1998 went from being more than half a degree cooler than 1934, to warmer than 1934:

Spectacularly Poor Climate Science At NASA | Real Science
NASA didn’t like the 1940’s warmth in Iceland, so they simply erased it:
The Arctic warming from 1910 to 1940 completely wrecks the alarmist’s story. Fortunately for them, they control the NASA and NOAA data and can tamper with it any way they want to produce data which matches their theory.
They are constantly cooling the past in Iceland, with their latest handiwork shown below.
Original version : Data.GISS: GISS Surface Temperature Analysis
Most recent tampering : Data.GISS: GISS Surface Temperature Analysis
What they can’t tamper with is the written record of eyewitnesses.

18 Feb 1952 – POLAR ICE THAW INCREASING GLACIERS SAID TO [?] M…
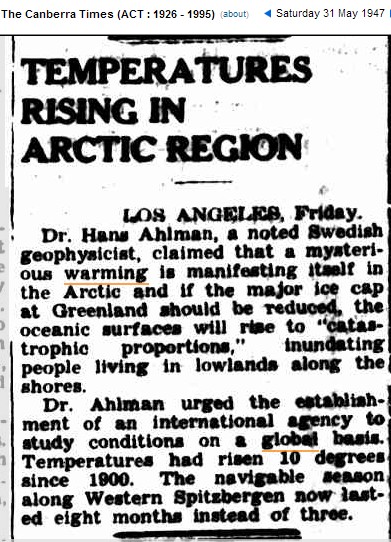
31 May 1947 – TEMPERATURES RISING IN ARCTIC REGION LOS ANGELES…
Latest GISS Data Tampering In Iceland | Real Science
•••
See also :
- Met Office Data Confirms Record Drop Of Global Temperatures | Climatism
Related :
- All Warming In NSW And Victoria Is Due To UHI | Climatism
- It Is All UHI In NSW | Climatism
- Measuring global temperatures: Satellites or thermometers? CFACT
- How not to measure temperature (or climate change) #96 | Climatism
- Gavin’s admission about the satellite record versus the surface temperature record | Climatism
- Shock News : “Heat Island Effect” Warms Temperature Data | Climatism
NASA Data Fraud Related :
- Another View Of NASA Temperature Data Tampering | Climatism
- GISS Data Tampering – Worse Than You Thought | Real Science
- GISS/NOAA/CRU Climate Fraud Update | Real Science
- Smoking Gun That The Temperature Record Is Fraudulent | Real Science
- Man Made Global Warming Is A Complete Fraud | Real Science
- NASA Massively Tampering With The US Temperature Record | Real Science
- NASA’s Quest To Erase The Warm 1930′s | Climatism
- Spectacularly Poor Climate Science At NASA
- Data Tampering At USHCN/GISS
- Thermometer Magic
- EPA Throws Their Hat Into The Temperature Fraud Arena
Australia Massaged Adjustment / UHI Related :
- Threat of ANAO Audit means Australia’s BOM throws out temperature set, starts again « JoNova
- UAH – How Angry Was Summer? | kenskingdom
- Samuel’s Blog » Bureau overheat figures by 4 degrees! (2013 was not Australia’s hottest year on record)
- Jennifer Marohasy » Open Letter Requesting Verification of 2013 Temperature Record
- Australia’s record hottest 12 month period? Junk science say the Satellites | Climatism
- RSS Shows No Warming In Australia | Climatism
- Oh Wait! Bricks and mortar will create warmer nights (weren’t we supposed to blame CO2 for that?) « JoNova
- MUST READ The Urban Heat Island effect: Could Africa be more affected than the US? « JoNova
- Is there any unmassaged data out there? « JoNova
- Australian warming trend adjusted UP by 40% « JoNova
Like this:
Like Loading...
Posted: July 3, 2016 | Author: Jamie Spry | Filed under: Carbon Dioxide, Climate science, Empirical Evidence, Fact Check, Failed Climate Models, Global Cooling, Global Temperature, Global Warming Stasis, Green Agenda, Science, UAH | Tags: Dr Roy Spencer, global cooling, Global Temperature, Global Warming "Pause", Global Warming Hiatus, Global Warming Scam, Global Warming stasis, science, UAH satellite data |
The current ~20 year global warming / climate change “hiatus/pause” set to continue (post El Niño), despite record and increasing CO2 emissions!
Global Warming theory check?
Watts Up With That?
UAH Global Temperature Update for June 2016: +0.34 deg. C
by Roy W. Spencer, Ph. D.
The Version 6.0 global average lower tropospheric temperature (LT) anomaly for June, 2016 is +0.34 deg. C, down 0.21 deg. C from the May value of +0.55 deg. C (click for full size version):
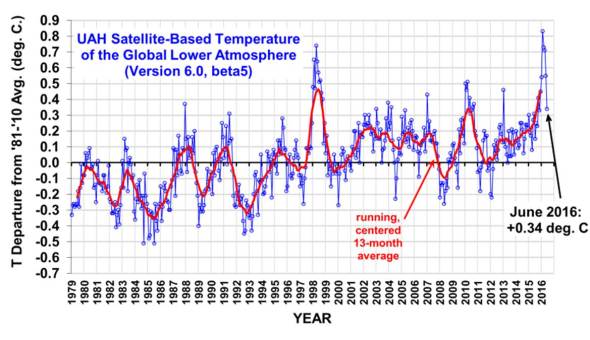
This gives a 2-month temperature fall of -0.37 deg. C, which is the second largest in the 37+ year satellite record…the largest was -0.43 deg. C in Feb. 1988.
In the tropics, there was a record fast 2-month cooling of -0.56 deg. C, just edging out -0.55 deg. C in June 1998 (also an El Nino weakening year). […]
The rapid cooling is from the weakening El Nino and approaching La Nina conditions by mid-summer or early fall.
As promised just over a week ago, here’s how we are now progressing toward a record warm year in the satellite…
View original post 607 more words
Like this:
Like Loading...
Posted: May 5, 2016 | Author: Jamie Spry | Filed under: Alarmism Debunked, Climatism, Failed Climate Models, Gavin Schmidt, Global Temperature, Government Grants/Funding, Govt Climate Agenda, NASA, NOAA, Satellite Data, UAH, UHI | Tags: Global Temperature, Hottest Year Ever, nasa, NOAA, propaganda, RSS Satellite Data, UAH satellite data, UHI |
Been hearing that 2015 was the hottest year on record? This depends entirely on which temperature data set is being referred. There are two main methods of measuring global temperature:
- The much more accurate and comprehensive satellite measurement systems, RSS/UAH, which measure the average temperature of every cubic inch of the lower atmosphere, the exact place where global warming theory is meant to occur and be measured! Or…
- NASA and NOAA’s preferred surface-based thermometers which measure “different parts of the system [UHI affected parking lots, asphalt heat sinks, AC exhaust air vents], different signal to noise ratio [we bias toward warm stations], different structural uncertainty [we ‘homogenise’ the data set to cool the past and warm the present to fit the global warming narrative].” – NASA GISS Gavin Schmidt’s admission about the satellite record versus the surface temperature record (doctored in square brackets by Climatism)
- The other issue with surface-based thermometer readings is that you can travel hundreds if not thousands of kilometres without finding a thermometer nearby. The Arctic region is a great example of this, as well the oceans which cover 70 percent of the planet.
With the ever increasing divergence of surface temperatures (NASA GISS) from satellite ones (UAH/RSS), and the subsequent divergence of overheated climate models (IPCC CMIP5) to observed reality, it is worth some background on the temperature measurement systems used to measure global temperature and fundamentally to help combat misinformation about NASA and NOAA’s “Hottest Year Ever” – PR claims that tell us everything about marketing, and nothing about science…

Measuring global temperatures: Satellites or thermometers?
via CFACT
January 26, 2016 by Dr. Roy Spencer
The University of Alabama in Huntsville
The official global temperature numbers are in, and NOAA and NASA have decided that 2015 was the warmest year on record. Based mostly upon surface  thermometers, the official pronouncement ignores the other two primary ways of measuring global air temperatures, satellites and radiosondes (weather balloons).
The fact that those ignored temperature datasets suggest little or no warming for about 18 years now, it is worth outlining the primary differences between these three measurement systems.
Three Ways to Measure Global Temperatures
The primary ways to monitor global average air temperatures are surface based thermometers (since the late 1800s), radiosondes (weather balloons, since about the 1950s), and satellites measuring microwave emissions (since 1979). Other technologies, such as GPS satellite based methods have limited record length and have not yet gained wide acceptance for accuracy.
While the thermometers measure near-surface temperature, the satellites and radiosondes measure the average temperature of a deep layer of the lower atmosphere. Based upon our understanding of how the atmosphere works, the deep layer temperatures are supposed to warm (and cool) somewhat more strongly than the surface temperatures. In other words, variations in global average temperature are expected to be magnified with height, say through the lowest 10 km of atmosphere. We indeed see this during warm El Nino years (like 2015) and cool La Nina years.
The satellite record is the shortest, and since most warming has occurred since the 1970s anyway we often talk about temperature trends since 1979 so that we can compare all three datasets over a common period.
Temperatures of the deep ocean, which I will not address in detail, have warmed by amounts so small — hundredths of a degree — that it is debatable whether they are accurate enough to be of much use. Sea surface temperatures, also indicating modest warming in recent decades, involve an entirely new set of problems, with rather sparse sampling by a mixture of bucket temperatures from many years ago, to newer ship engine intake temperatures, buoys, and since the early 1980s infrared satellite measurements.
How Much Warming?
Since 1979, it is generally accepted that the satellites and radiosondes measure 50% less of a warming trend than the surface thermometer data do, rather than 30-50% greater warming trend that theory predicts for warming aloft versus at the surface.
This is a substantial disagreement.
Why the Disagreement?
There are different possibilities for the disagreement:
1) Surface thermometer analyses are spuriously overestimating the true temperature trend
2) Satellites and radiosondes are spuriously underestimating the true temperature trend
3) All data are largely correct, and are telling us something new about how the climate system operates under long-term warming.
First let’s look at the fundamental basis for each measurement.
All Temperature Measurements are “Indirect”
Roughly speaking, “temperature” is a measure of the kinetic energy of motion of molecules in air.
Unfortunately, we do not have an easy way to directly measure that kinetic energy of motion.
Instead, many years ago, mercury-in-glass or alcohol-in-glass thermometers were commonly used, where the thermal expansion of a column of liquid in response to temperature was estimated by eye. These measurements have now largely been replaced with thermistors, which measure the resistance to the flow of electricity, which is also temperature-dependent.
Such measurements are just for the air immediately surrounding the thermometer, and as we all know, local sources of heat (a wall, pavement, air conditioning or heating equipment, etc.) can and do affect the measurements made by the thermometer. It has been demonstrated many times that urban locations have higher temperatures than rural locations, and such spurious heat influences are difficult to eliminate entirely, since we tend to place thermometers where people live.
Radiosondes also use a thermistor, which is usually checked against a separate thermometer just before weather balloon launch. As the weather balloon carries the thermistor up through the atmosphere, it is immune from ground-based sources of contamination, but it still has various errors due to sunlight heating and infrared cooling which are minimized through radiosonde enclosure design. Radiosondes are much fewer in number, generally making hundreds of point measurements around the world each day, rather than many thousands of measurements that thermometers make.
Satellite microwave radiometers are the fewest in number, only a dozen or so, but each one is transported by its own satellite to continuously measure virtually the entire earth each day. Each individual measurement represents the average temperature of a volume of the lower atmosphere about 50 km in diameter and about 10 km deep, which is about 25,000 cubic kilometers of air. About 20 of those measurements are made every second as the satellite travels and the instrument scans across the Earth.
The satellite measurement itself is “radiative”: the level of microwave emission by oxygen in the atmosphere is measured and compared to that from a warm calibration target on the satellite (whose temperature is monitored with several highly accurate platinum resistance thermometers), and a cold calibration view of the cosmic background radiation from space, assumed to be about 3 Kelvin (close to absolute zero temperature). A less sophisticated (infrared) radiation temperature measurement is made with the medical thermometer you place in your ear.
So, Which System is Better?
The satellites have the advantage of measuring virtually the whole Earth every day with the same instruments, which are then checked against each other. But since there are very small differences between the instruments, which can change slightly over time, adjustments must be made.
Thermometers have the advantage of being much greater in number, but with potentially large long-term spurious warming effects depending on how each thermometer’s local environment has changed with the addition of manmade objects and structures.
Virtually all thermometer measurements require adjustments of some sort, simply because with the exception of a few thermometer sites, there has not been a single, unaltered instrument measuring the same place for 30+ years without a change in its environment. When such rare thermometers were identified in a recent study of the U.S., it was found that by comparison the official U.S. warming trends were exaggerated by close to 60%. Thus, the current official NOAA adjustment procedures appear to force the good data to match the bad data, rather than the other way around. Whether such problem exist with other countries data remains to be seen.
Changes in radiosonde design and software have occurred over the years, making some adjustments necessary to the raw data.
For the satellites, orbital decay of the satellites requires an adjustment of the “lower tropospheric” (LT) temperatures, which is well understood and quite accurate, depending only upon geometry and the average rate of temperature decrease with altitude. But the orbital decay also causes the satellites to slowly drift in the time of day they observe. This “diurnal drift” adjustment is less certain. Significantly, very different procedures for this adjustment have led to almost identical results between the satellite datasets produced by UAH (The University of Alabama in Huntsville) and RSS (Remote Sensing Systems, Santa Rosa, California).
The fact that the satellites and radiosondes – two very different types of measurement system — tend to agree with each other gives us somewhat more confidence in their result that warming has been much less than predicted by climate models. But even the thermometers indicate less warming than the models, just with less of a discrepancy.
And this is probably the most important issue…that no matter which temperature monitoring method we use, the climate models that global warming policies are based upon have been, on average, warming faster than all of our temperature observation systems.
I do believe “global warming” has occurred, but (1) it is weaker than expected, based upon independent satellite and weather balloon measurements; (2) it has been overestimated with poorly adjusted surface-based thermometers; (3) it has a substantial natural component; and (4) it is likely to be more beneficial to life on Earth than harmful.
About the Author: Dr. Roy Spencer
Roy W. Spencer is a Principal Research Scientist at the University of Alabama in Huntsville. He received his Ph.D. in Meteorology from the University of Wisconsin in 1981. As Senior Scientist for Climate Studies at NASA’s Marshall Space Flight Center, Dr. Spencer previously directed research into the development and application of satellite passive microwave remote sensing techniques for measuring global temperature, water vapor, and precipitation. He is co-developer of the original satellite method for precision monitoring of global temperatures from Earth-orbiting satellites. Dr. Spencer also serves as U.S. Team Leader for the Advanced Microwave Scanning Radiometer for EOS (AMSR-E) flying on NASA’s Terra satellite. He has authored numerous research articles in scientific journals, and has provided congressional testimony several times on the subject of global warming.
•••
See also :
- NASA and NOAA Climate Fraud Files – Climatism
- UHI (Urban Heat Island) Effect Files – Climatism
- No, 2015 Was Not The Hottest Year Evah… – Breitbart
- Warmest Year Evah? Maybe, But Not According To NOAA! | NOT A LOT OF PEOPLE KNOW THAT
Like this:
Like Loading...
Posted: December 7, 2015 | Author: Jamie Spry | Filed under: Alarmism Debunked, Climate Change, Climate Fraud, Climatism, COP21, Data Tampering, Empirical Evidence, Fact Check, Global Temperature, NASA, Satellite Data, UAH | Tags: Alarmism debunked, Climate Change, COP21, Data Fraud, Data Tampering, Dr Roy Spencer, Empirical Evidence, GISS, Global Temperature, Global Warming "Pause", RSS Satellite Data, Satellite Data, UAH |
Warming fears are the “worst scientific scandal in the history…When people come to
know what the truth is, they will feel deceived by science and scientists.” – UN IPCC
Japanese Scientist Dr. Kiminori Itoh, an award-winning PhD environmental physical
chemist.
“It is a blatant lie put forth in the media that makes it seem there is only a fringe of
scientists who don’t buy into anthropogenic global warming.” – U.S Government
Atmospheric Scientist Stanley B. Goldenberg of the Hurricane Research Division of
NOAA.
“The whole climate change issue is about to fall apart — Heads will roll!” – South African UN Scientist Dr. Will Alexander, April 12, 2009
“I am a skeptic…Global warming has become a new religion.” – Nobel Prize Winner for
Physics, Ivar Giaever.
 •••
•••
Dr Roy Spencer, former senior scientist for Climate studies at NASA’s Marshall Space Flight Center, and current principal research scientist for the University of Alabama in Huntsville, reports that 2015 will not be “The Hottest Year Ever” despite a strong El Niño …. and even stronger hot-air from the climate alarm industry.
2015 will be the 3rd Warmest Year in the Satellite Record
December 3rd, 2015
Way back in June, John Christy and I called 2015 as being the warmest year on record…in the surface thermometer data. Given the strong El Nino in progress, on top of the official thermometer data warming trend, this seemed pretty obvious.
Of course, everyone has their opinions regarding how good the thermometer temperature trends are, with periodic adjustments that almost always make the present warmer or the past colder.
But I’m not going there today…
Instead, I’m going to talk about our only truly global dataset: the satellite data. With the November 2015 data now in, it’s pretty clear that in our UAH analysis 2015 will only be the 3rd warmest year since the satellite record began in 1979. Based upon my calculations, this will be true no matter what happens in December (barring Armageddon).
Here are the yearly rankings, for which I assumed the December 2015 anomaly will be +0.40 C (click for full-size):

The years are displayed with the warmest on the left, and the coldest on the right. The color coding and arrows have to do with El Nino years…
Read on …
2015 will be the 3rd Warmest Year in the Satellite Record « Roy Spencer, PhD
•••
UAH and RSS
With the ever increasing divergence of surface temperatures (NASA GISS) from satellite ones (UAH/RSS), and the subsequent divergence of overheated climate models (IPCC CMIP5) to observed reality, it is worth some background on the atmospheric temperature measurement systems used to measure the temperature of the lower troposphere – the exact place where global warming theory is meant to occur and be measured :
Roy Spencer :
…if for no other reason than this: thermometers cannot measure global averages — only satellites can. The satellite instruments measure nearly every cubic kilometer – hell, every cubic inch — of the lower atmosphere on a daily basis. You can travel hundreds if not thousands of kilometers without finding a thermometer nearby.
The two main research groups tracking global lower-tropospheric temperatures (our UAH group, and the Remote Sensing Systems [RSS] group) show 2014 lagging significantly behind 2010 and especially 1998:
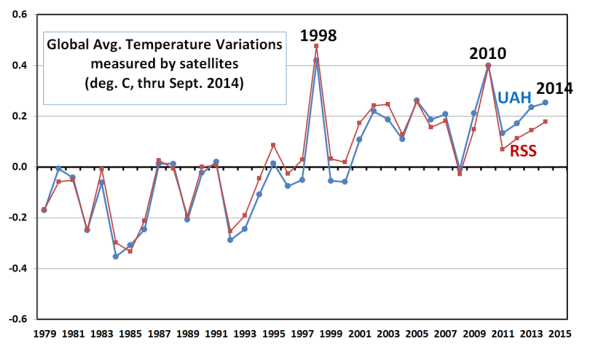
With only 3 months left in the year, there is no realistic way for 2014 to set a record in the satellite data.
Granted, the satellites are less good at sampling right near the poles, but compared to the very sparse data from the thermometer network we are in fat city coverage-wise with the satellite data.
In my opinion, though, a bigger problem than the spotty sampling of the thermometer data is the endless adjustment game applied to the thermometer data. The thermometer network is made up of a patchwork of non-research quality instruments that were never made to monitor long-term temperature changes to tenths or hundredths of a degree, and the huge data voids around the world are either ignored or in-filled with fictitious data.
Furthermore, land-based thermometers are placed where people live, and people build stuff, often replacing cooling vegetation with manmade structures that cause an artificial warming (urban heat island, UHI) effect right around the thermometer. The data adjustment processes in place cannot reliably remove the UHI effect because it can’t be distinguished from real global warming.
Satellite microwave radiometers, however, are equipped with laboratory-calibrated platinum resistance thermometers, which have demonstrated stability to thousandths of a degree over many years, and which are used to continuously calibrate the satellite instruments once every 8 seconds. The satellite measurements still have residual calibration effects that must be adjusted for, but these are usually on the order of hundredths of a degree, rather than tenths or whole degrees in the case of ground-based thermometers.
And, it is of continuing amusement to us that the global warming skeptic community now tracks the RSS satellite product rather than our UAH dataset. RSS was originally supposed to provide a quality check on our product (a worthy and necessary goal) and was heralded by the global warming alarmist community. But since RSS shows a slight cooling trend since the 1998 super El Nino, and the UAH dataset doesn’t, it is more referenced by the skeptic community now. Too funny.
In the meantime, the alarmists will continue to use the outdated, spotty, and heavily-massaged thermometer data to support their case. For a group that trumpets the high-tech climate modeling effort used to guide energy policy — models which have failed to forecast (or even hindcast!) the lack of warming in recent years — they sure do cling bitterly to whatever will support their case.
As British economist Ronald Coase once said, “If you torture the data long enough, it will confess to anything.”
So, why are the surface thermometer data used to the exclusion of our best technology — satellites — when tracking global temperatures? Because they better support the narrative of a dangerously warming planet.
Except, as the public can tell, the changes in global temperature aren’t even on their radar screen (sorry for the metaphor).
Why 2014 Won’t Be the Warmest Year on Record « Roy Spencer, PhD
•••
UPDATE
The temperature divergence, this century, between NASA GISS temp (land based) and RSS satellite data, is mind-blowing.
Looks like someone is adjusting the curve to fit the ‘global warming’ narrative. Gavin? Tom?
Paul Homewood from NOT A LOT OF PEOPLE KNOW THAT :
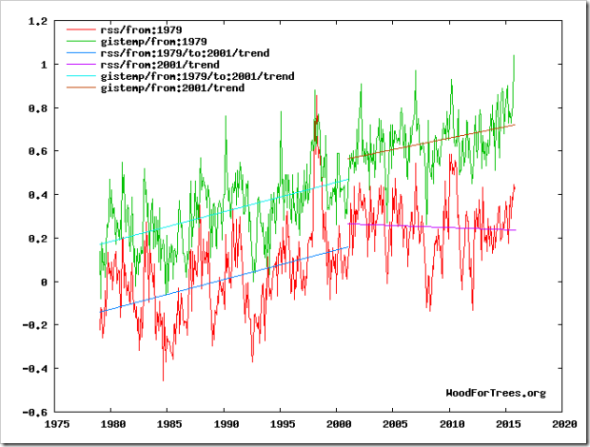
Between 1979 and 2001, the RSS satellite data increased at virtually the same rate as GISS. Since then, there has been a massive divergence, with GISS claiming that the pace of increase has barely reduced from the earlier period.
In contrast RSS (and also UAH) confirm that, if anything, temperatures have been dropping.
Wood for Trees: Interactive Graphs
It’s time to call the fraud squad in.
•••
Related :
- The robust Pause resists a robust el Niño Still no global warming at all for 18 years 9 months | Climatism
- RSS Continues To Diverge From GISS | Climatism
- The Pause draws blood – A new record Pause length: no warming for 18 years 7 months | Climatism
- Yes, there is a pause, and the Washington Post now admits it. UPDATE: But not Obama | Climatism
- 97% of climate models say that 97% of climate scientists are wrong | Climatism
- Biggest Fraud In History – Perpetrated By Tom Karl And Gavin Schmidt | Climatism
- Government Scientists Continue To Ramp Up Their Criminal Activity Ahead Of Paris | Climatism
Climate alarmist industry headlines “Hottest Year Ever” :
- 2015 Likely to Be Hottest Year Ever Recorded – The New York Times
- WMO: 2015 likely to be Warmest on Record, 2011-2015 Warmest Five Year Period | Media Centre
- U.N. Says 2015 Has Been Hottest Year On Record – Fortune
Like this:
Like Loading...
Posted: December 5, 2015 | Author: Jamie Spry | Filed under: COP21, Fact Check, Failed Climate Models, Global Temperature, Global Warming Stasis, NASA, NOAA, Satellite Data, UAH | Tags: "The Pause", COP21, GISS, Global Warming "Pause", Global Warming Hiatus, nasa, RSS Satellite Data, Satellite Data, UAH satellite data |
With the ever increasing divergence of surface temperatures from satellite ones, and the subsequent divergence of overheated climate models to observed reality, it is worth a background on atmospheric measurement systems from former NASA climate scientist Dr. Roy Spencer, Ph.D. – climatologist at the University of Alabama in Huntsville who he developed the first temperature record based on satellites…
Roy Spencer On Satellite (UAH / RSS) v Surface Temperature Data (NASA GISS) :
I claim 2014 won’t be the warmest global-average year on record.
..if for no other reason than this: thermometers cannot measure global averages — only satellites can. The satellite instruments measure nearly every cubic kilometer – hell, every cubic inch — of the lower atmosphere on a daily basis. You can travel hundreds if not thousands of kilometers without finding a thermometer nearby.
(And even if 2014 or 2015 turns out to be the warmest, this is not a cause for concern…more about that later).
The two main research groups tracking global lower-tropospheric temperatures (our UAH group, and the Remote Sensing Systems [RSS] group) show 2014 lagging significantly behind 2010 and especially 1998:

With only 3 months left in the year, there is no realistic way for 2014 to set a record in the satellite data.
Granted, the satellites are less good at sampling right near the poles, but compared to the very sparse data from the thermometer network we are in fat city coverage-wise with the satellite data.
In my opinion, though, a bigger problem than the spotty sampling of the thermometer data is the endless adjustment game applied to the thermometer data. The thermometer network is made up of a patchwork of non-research quality instruments that were never made to monitor long-term temperature changes to tenths or hundredths of a degree, and the huge data voids around the world are either ignored or in-filled with fictitious data.
Furthermore, land-based thermometers are placed where people live, and people build stuff, often replacing cooling vegetation with manmade structures that cause an artificial warming (urban heat island, UHI) effect right around the thermometer. The data adjustment processes in place cannot reliably remove the UHI effect because it can’t be distinguished from real global warming.
Satellite microwave radiometers, however, are equipped with laboratory-calibrated platinum resistance thermometers, which have demonstrated stability to thousandths of a degree over many years, and which are used to continuously calibrate the satellite instruments once every 8 seconds. The satellite measurements still have residual calibration effects that must be adjusted for, but these are usually on the order of hundredths of a degree, rather than tenths or whole degrees in the case of ground-based thermometers.
And, it is of continuing amusement to us that the global warming skeptic community now tracks the RSS satellite product rather than our UAH dataset. RSS was originally supposed to provide a quality check on our product (a worthy and necessary goal) and was heralded by the global warming alarmist community. But since RSS shows a slight cooling trend since the 1998 super El Nino, and the UAH dataset doesn’t, it is more referenced by the skeptic community now. Too funny.
In the meantime, the alarmists will continue to use the outdated, spotty, and heavily-massaged thermometer data to support their case. For a group that trumpets the high-tech climate modeling effort used to guide energy policy — models which have failed to forecast (or even hindcast!) the lack of warming in recent years — they sure do cling bitterly to whatever will support their case.
As British economist Ronald Coase once said, “If you torture the data long enough, it will confess to anything.”
So, why are the surface thermometer data used to the exclusion of our best technology — satellites — when tracking global temperatures? Because they better support the narrative of a dangerously warming planet.
Except, as the public can tell, the changes in global temperature aren’t even on their radar screen (sorry for the metaphor).
via Roy Spencer On Satellite v Surface Temperature Data | NOT A LOT OF PEOPLE KNOW THAT
2015 “Hottest Year Ever” Update :
2015 will be the 3rd Warmest Year in the Satellite Record « Roy Spencer, PhD
Watts Up With That?
By Christopher Monckton of Brenchley
The Christmas pantomime here in Paris is well int0 its two-week run. The Druids who had hoped that their gibbering incantations might begin to shorten the Pause during the United Necromancers’ pre-solstice prayer-group have been disappointed. Gaia has not heeded them. She continues to show no sign of the “fever” long promised by the Prophet Gore. The robust Pause continues to resist the gathering el Niño. It remains at last month’s record-setting 18 years 9 months (Fig. 1).

Figure 1. The least-squares linear-regression trend on the RSS satellite monthly global mean surface temperature anomaly dataset continues to show no global warming for 18 years 9 months since February 1997, though one-third of all anthropogenic forcings have occurred during the period of the Pause.
The modelers ought to be surprised by the persistence of the Pause. NOAA, with rare honesty, said in its 2008 State of…
View original post 4,467 more words
Like this:
Like Loading...
Posted: September 24, 2013 | Author: Jamie Spry | Filed under: Climate, Global Warming Stasis, Govt Climate Agenda, Obama, Satellite Data, Science, UAH |
UPDATE
Obama Pivots To Climate Change
Posted on 24-Jun-2013 by cosmoscon
Now that Obama fixed our economic crisis and everyone who wants a job has a job……He’s going to tackle Climate Change next.
While Obama is bloviating about a topic that he knows nothing about, keep the following 5 graphs on your screen. Then ask yourself why we have a President who lacks the skills to prioritize and think critically.
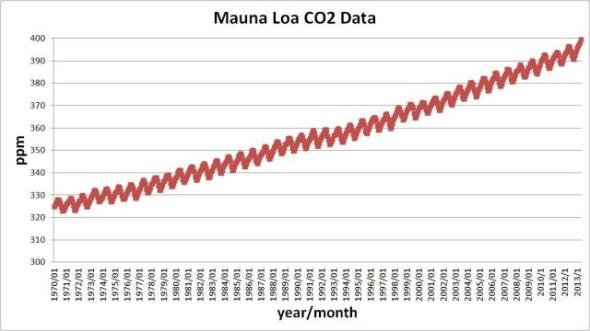
- Atmospheric CO2 concentrations have been steadily increasing since we’ve been measuring it.
Using two different data sets, Global temperature anomalies have been flat for 15 years.
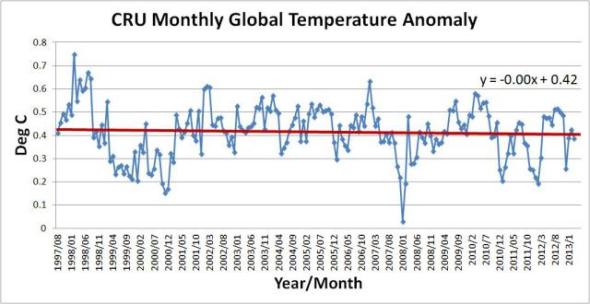

There has been zero correlation between atmospheric CO2 concentrations and global temperature anomalies during the past 15 years.

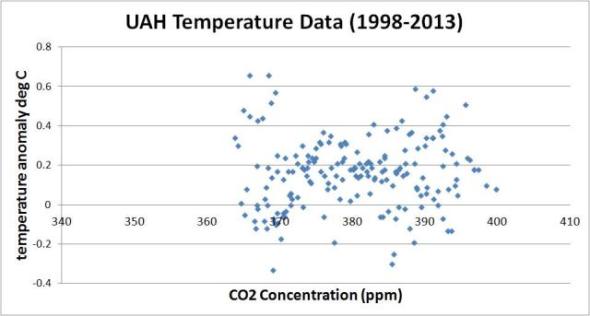
Note – Links to the above data sets can be found at a previous post here.
 cosmoscon
Obama is now making another one of his favorite pivots – this time to Climate Change.
“President Barack Obama is preparing to tell all federal agencies for the first time that they should consider the impact on global warming before approving major projects, from pipelines to highways.”
The Anthropogenic Global Warming (AGW) cult continues to peddle their junk science and Leftists are all too eager to buy it. The Leftist have no need to challenge the AGW theories and compare them with measurable data because they don’t want to learn the real inconvenient truth. It’s easy for them to buy what the AGW cult is selling (and tell others to do the same because the ‘science is settled’ or something) because the AGW message feels so good to them. If the Left believes Humans (and more importantly human industries) are polluting the planet and causing environmental/climate catastrophes, then they…
View original post 403 more words
Like this:
Like Loading...


Recent Comments