
Obama Blames Poor GDP On (Unadjusted) Cold Weather!
Posted: May 31, 2014 Filed under: Uncategorized 1 CommentNOT A LOT OF PEOPLE KNOW THAT
By Paul Homewood

http://www.whitehouse.gov/blog/2014/05/29/second-estimate-gdp-first-quarter-2014
The White House has released their latest disappointing estimate for Q1 GDP, and comment:
Overall the first quarter was subject to a number of notable influences, including historically severe winter weather, which temporarily lowered growth.
They go on to show this graph of heating days and comment:
The first quarter of 2014 was marked by unusually severe winter weather, including record cold temperatures and snowstorms, which explains part of the difference in GDP growth relative to previous quarters. The left chart shows the quarterly deviation in heating degree days from its average for the same quarter over the previous five years. By this measure, the first quarter of 2014 was the third most unusually cold quarter over the last sixty years, behind only the first quarter of 1978 and the fourth quarter of 1976.

This is all rather strange, because the heavily adjusted temperatures, published…
View original post 65 more words
40 Years Since Climate Scientists Warned Us! The New Ice Age Is Going To Starve Us To Death
Posted: May 31, 2014 Filed under: Uncategorized 1 CommentReal Science
http://pqasb.pqarchiver.com/
http://pqasb.pqarchiver.com/
http://pqasb.pqarchiver.com/
View original post
1947 Shock News : 10 Degrees Arctic Warming To Melt The Polar Ice Caps And Drown The Planet
Posted: May 30, 2014 Filed under: Uncategorized 1 CommentReal Science
A real wake up call from 70 years ago! The Arctic was warming catastrophically, and was going to melt and drown us all.
31 May 1947 – ARCTIC CLIMATE’S ALARMING CHANGE
Perhaps after scientists recycle this story for the 100th time, someone will pay attention.
View original post
40 Years Ago : Scientists Said The Cooling Trend Was causing Erratic Weather And Starvation
Posted: May 28, 2014 Filed under: Uncategorized 2 CommentsReal Science
NASA has recently erased the post-1940 cooling trend, but prominent scientists who studied it at the time said that it was causing erratic weather, crop failures and mass starvation.
Ultimately, Weather Will Decide the Food Supply – Early Rain and Early Frost Are the 1974 Culprits in the U.S. The Drought-Cluster Theory – View Article – NYTimes.com
View original post
Global Sea Ice Area Is Growing By The Area Of France Every Eight Months
Posted: May 28, 2014 Filed under: Uncategorized 1 CommentReal Science
 arctic.atmos.uiuc.edu/cryosphere/timeseries.global.anom.1979-2008
View original post
Can We Save The San Francisco Airport?
Posted: May 16, 2014 Filed under: Uncategorized Leave a commentReal Science
Anthony Watts reported yesterday that Jerry Brown is worried about LAX drowning, as it is only 125 feet above sea level. But what about SFO, which is only 10 feet or so above the Bay? At current rates of sea level rise, SFO will be underwater in only infinity years.
Data and Station Information for ALAMEDA (NAVAL AIR STATION)
View original post
Satellites Or Surface Data?
Posted: May 16, 2014 Filed under: Uncategorized Leave a commentReal Science
Climate scientists choose to use whatever data brings in funding.
With temperature, they use UHI contaminated tampered surface data – and ignore much more accurate satellite data which shows no warming.
With sea level, they use tampered satellite data – and ignore surface data which shows no change in trend.
View original post
Measuring Greenhouse Gas Warming Of The Atmosphere
Posted: May 16, 2014 Filed under: Uncategorized 1 CommentReal Science
Satellite data provides continuous high resolution temperature information across almost all regions of the Earth, and across all the layers of the atmosphere.
By contrast, surface data provides spotty low-resolution data which is UHI contaminated, tampered with, and scientists say suffers severely from time of observation bias.
Scientists of course choose to use the meaningless surface data, because the satellite data doesn’t show any warming.
Never mind that NASA says the satellite data is more accurate. Funding is the important thing.
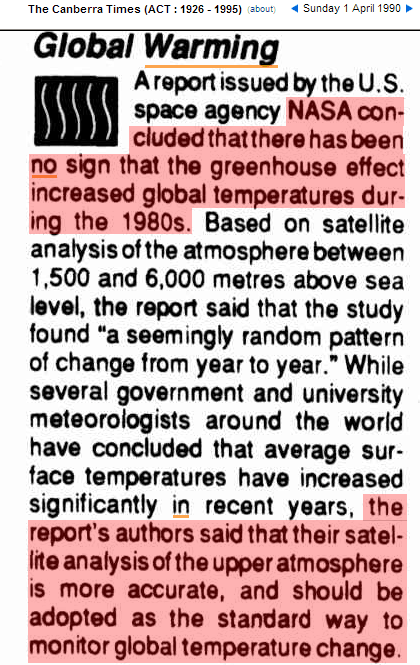
01 Apr 1990 – EARTHWEEK: A DIARY OF THE PLANET Global Warming
View original post
Understanding How To Make Up Fake Data For NASA
Posted: May 16, 2014 Filed under: Uncategorized 1 CommentReal Science
Gavin made up a fake 4-8 degree April anomaly across a region of Siberia and the Arctic where he had no data. Note the green circle.
Now compare vs. the green circle in satellite data, which was actually measured. Gavin missed by 4-8 degrees in that region, and thus was able to declare that April was 2nd hottest ever.
It doesn’t take a very large area of fake +8 anomaly to bump global temperatures up by 0.3C.
View original post
Tracing The Antarctic Scam
Posted: May 15, 2014 Filed under: Uncategorized Leave a commentReal Science
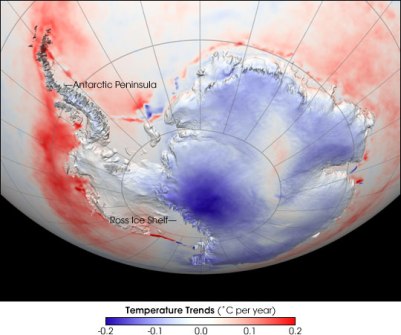
Ten years ago, Gavin said temperatures in Antarctica had “decreased significantly.”
Shindell and Schmidt 2004
While most of the Earth warmed rapidly during recent decades, surface temperatures decreased significantly over most of Antarctica.
Pubs.GISS: Abstract of Shindell and Schmidt 2004
NASA published maps showing the strong cooling in Antarctica
SVS Animation 3188 – Antarctic Heating and Cooling Trends
A couple of years later someone at NASA figured out that Antarctic cooling didn’t fit the agenda. so they simply changed it into warming.
Disintegration: Antarctic Warming Claims Another Ice Shelf : Feature Articles
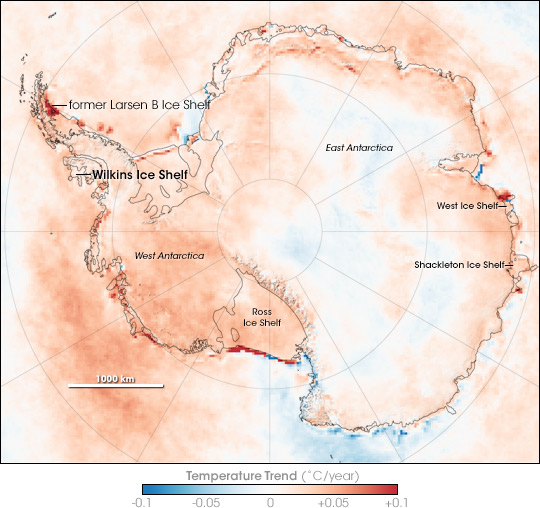
Now they have taken it a step further. NASA has completely ignored the record sea ice, and has fabricated a nonsensical story about deep ocean heat melting the ice from below.
Satellites show that Antarctica is cooling, just as Gavin said 10 years ago – before politics replaced science.
MSU_AMSU_Channel_tlt_Trend_Map_v03_3_1979_2013.730_450.png (730×450)
View original post

Recent Comments