Calling It a Crisis and Covering It Like One – Public Citizen
“PEOPLE have been imagining that the climate is changing, exaggerating every weather event, getting widespread press coverage, and blaming it on man – for as long as there have been newspapers.”
– Tony Heller
Climate Change Insanity Never Changes
DEEP within human nature there are certain types of people who yearn for catastrophe. They yearn to have significance in their lives believing that theirs is the time when the chickens are coming home to roost and everything is going to go tits up.
THE biggest selling environmental books in history, predict the mass destruction of the planet. Rachel Carson’s 1962 international bestseller “Silent Spring” predicted mass cancer from plant pesticides and DDT. Population freak, Paul Ehrlich’s 1968 book “The Population Bomb”, argued on Malthusian lines that population explosion would mean mass starvation around the world. People buy this stuff. They lap it up and books like this sell in droves, in a way that more reasonable books that say “hang on, lets look at the facts”, don’t.
MORE than half a century on, we still ‘yearn for catastrophe’. The perpetrator, still, ‘evil’ mankind.
“The Earth has cancer
and the cancer is Man.”
– Club of Rome (Eco consultants to the U.N.)
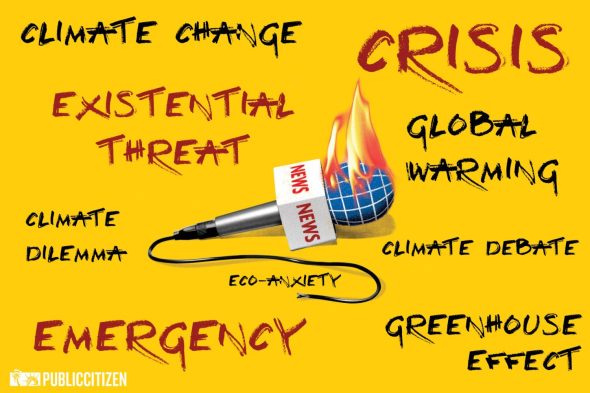
THIS time around; “Climate Catastrophe, “Climate Armageddon”, “Climate Crisis”, “Climate Emergency” and every other hyperbolic descriptor of climate and weather are all blamed on mankind’s excesses, chiefly its production of trace gas carbon dioxide – the byproduct of around ninety per cent of all global energy production.
ATMOSPHERIC Physicist, former MIT Professor of Meteorology and IPCC lead author Richard S. Lindzen, examines the politics and ideology behind the CO2-centricity that fuels the ClimateChange™️ agenda.
LINDZEN’s enlightening summary goes to the very heart of why Carbon Dioxide has become the centre-piece of the ‘global’ climate debate :
“For a lot of people including the bureaucracy in Government and the environmental movement, the issue is power. It’s hard to imagine a better leverage point than carbon dioxide to assume control over a society. It’s essential to the production of energy, it’s essential to breathing. If you demonise it and gain control over it, you so-to-speak, control everything. That’s attractive to people. It’s been openly stated for over forty years that one should try to use this issue for a variety of purposes, ranging from North/South redistribution, to energy independence, to God knows what…”
WITH a clearer understanding of why colourless, odourless, trace gas and plant-food carbon dioxide is demonised as “carbon pollution” by the zero-emissions-zealots, let’s wind back the clock to gain some historical perspective into the relentless bombardment of “Hottest Evahh” and “unprecedented” hyperbole that dominates the lexicon of the lazy mainstream media, deliberately fanning the flames of ClimateChange™️ hysteria.
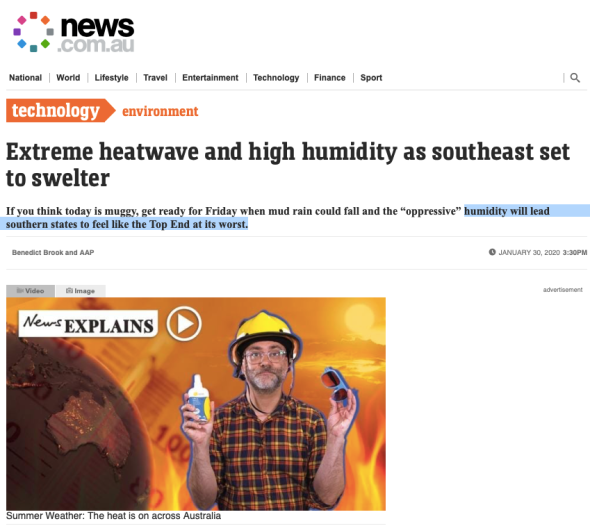
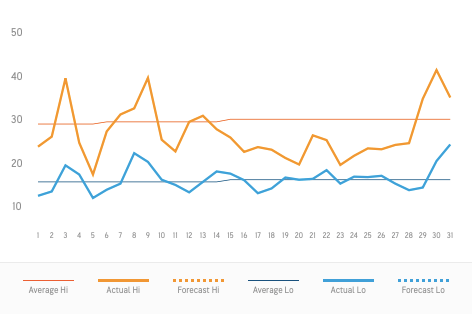
OVER the weekend, Adelaide, Melbourne and Sydney endured two days of January summer weather, prompting the usual suspects to default into extreme rhetoric mode.
Heatwave – Humidity so bad in Melbourne it will feel more like Darwin | NEWS.com
NOTE to news.com.au author : Australia’s Bureau of Meteorology defines a “heatwave” as “unusually hot conditions over a period of four days.”
THE “heatwave” that South-Eastern Australia just endured, lasted two days. A cool change arrived in Adelaide yesterday and Melbourne last night, ending the “Darwin” like climate…where humidity in Melbourne maxed at a mere 45% on Friday. Darwin’s relative humidity for January averages 71%. Wrong, wrong and deceptive again, the mainstream media.
*
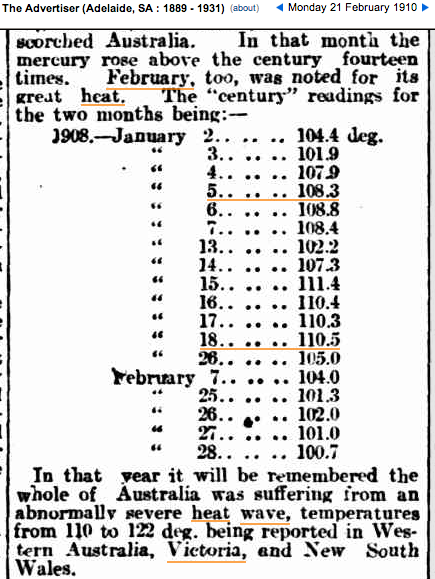
WHAT A REAL “HEATWAVE” LOOKS LIKE
IN 1908, when CO₂ was at “safe” levels, Adelaide experienced fourteen days of temperatures over 38°C (101.9°F minimum) in the month of January. The average temperature over these fourteen days was 142°C (107.3°F).
WHAT is even more astonishing is that the extreme month of heat was split into two mega-heatwaves lasting six days for the first and seven days for the second.
A cool change separated the two, though this would have brought little comfort to the population who endured the extended heatwaves without the luxury of AC!
THERE was little respite in February with another four-day heatwave delivering temps again over 100°F.
21 Feb 1910 – INTENSE HEAT AVERAGE FOR 8 DAYS, 101.5 DEGREES. …
*
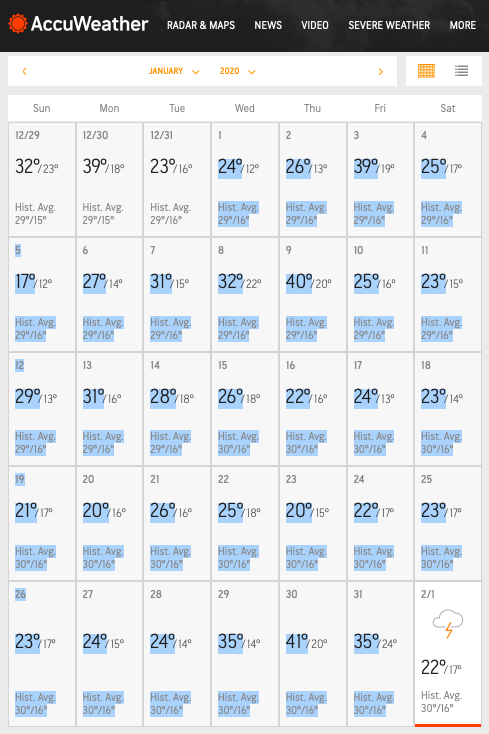
“CLIMATE EMERGENCY” ADELAIDE (JANUARY, 2020)
WITH current global CO₂ levels pushing an “unprecedented” (blah, blah…) 411 ppm it would track that heatwaves should be longer and hotter during the hottest month of the Australian year – January – and temps significantly higher. That is if CO₂ is doing its job properly.
UNFORTUNATELY for ClimateChange™️ “doomers” Adelaide max temps have been well below average for January with only three days above 38°C (101.9°F) and no consecutive days of ‘heatwave’.
Adelaide, South Australia, Australia Monthly Weather | AccuWeather
Adelaide, South Australia, Australia Monthly Weather | AccuWeather
MELBOURNE has been about average for January. With only two days above 38°C (101.9°F)
*
‘HISTORY IS HERESY!’
A recent tweet that compared January 2020 Adelaide max temps to those in January 1908, prompted this post.
ONE angry troll responder noted, “Wow so you presented two data points & drew a conclusion! Very scientific- did u get a science degree from a cornflakes packet???”.
Wow so you presented two data points & drew a conclusion! Very scientific- did u get a science degree from a cornflakes packet??? 🤦♀️
— Hope, just Hope💧💧💧 (@alison_rixon) January 27, 2020
SHE is right, two data points don’t necessarily ‘draw a conclusion’.
HOWEVER, just imagine if any capital city in the world, today, had two consecutive heatwaves in one month – with one lasting six days and the other, seven days with temps averaging 42°C (107.3°F) ?
THE mainstream media would have apoplexy, and @alison_rixon along with her Extinction Rebellion mates and GretaThunberg™️ in tow would be glueing themselves to the nearest sidewalk, demanding big employers be shut down, whilst pleading for global communism in order to stop the “CLIMATE CRISIS!”.
***
CONCLUSION
“The study of History
is the beginning of wisdom.” — Jean Bodin
AN area of great success for climate change realists, in the process of hitting back against dangerous and costly ClimateChange™️ alarmism and mainstream media eco-hysteria has been in the area of historical referencing. Comparing past climate and weather events to present ones.
CLIMATE sceptics are denounced as “deniers” for daring to use the past to nullify hysterical claims of the present or even the modelled future. ‘How dare’ anyone refute claims by ‘leading scientists’ that current conditions are “unprecedented”!
THE master of historical referencing has ‘historically’ been @Tony Heller aka Steve Goddard over at Real Climate Science. I urge you to checkout his excellent and powerful work. You will even get a good laugh, too! A very clever scientist, environmentalist and humanitarian.
YE shall know the truth and the truth shall make you [and your power bills] free.
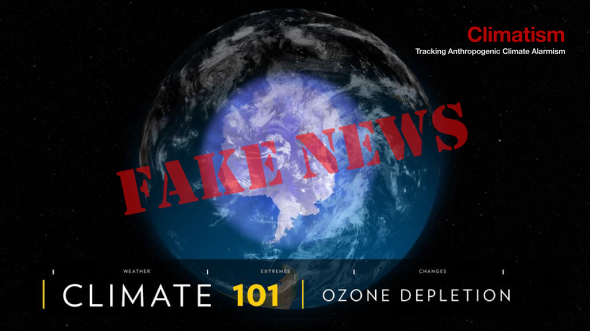
Whatever Happened to the Ozone Hole? | National Geograhic (Climatism pic edit)
“The whole aim of practical politics is to keep the populace alarmed (and hence clamorous to be led to safety) by menacing it with an endless series of hobgoblins, all of them imaginary.”
– H.L. Mencken
***
H/t @randybrown97
DO you remember where you were when the “hole in the ozone layer” ended all life on earth?
OF course, the machinations and hysteria by the scientific elite and fake news mainstream media, as-per-usual, were far worse and more costly than the observed outcome.
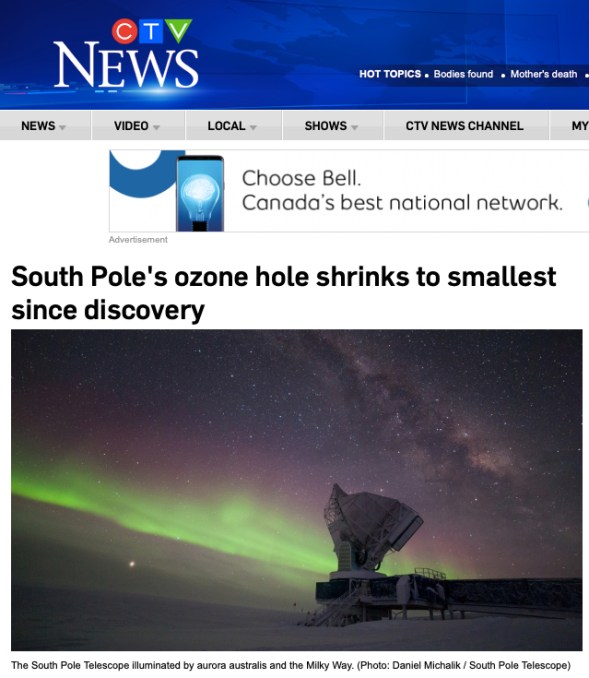
NASA now reports “The ozone hole near the south pole this year is the smallest since it was discovered…”. With, obligatory caveat including ‘evil’ mankind – “but it is more due to freakish Antarctic weather than efforts to cut down on pollution.”
South Pole’s ozone hole shrinks to smallest since discovery | CTV News
*
CONCLUSION
OBVIOUSLY, we can now chalk this one down as another epic fail from the ministry of “Settled Science” and the “97% consensus”.
WHY do we continue to listen to messages of doom and gloom from the scientific elite and the fake news mainstream media — forced to hand over our hard-earned taxpayer dollars, by the trillions — when not a single doomsday prediction has come true?
IS “SAVE THE PLANET!” virtue so valuable and important to society that NO one is ever held responsible or accountable for fake scares to 99% fake problems?
OR, is it that the dire predictions are so far extended into the future that everyone forgets who or how the alarmism started in the first place?
EITHER way, the initial cost to society is enormous – both financially and psychologically. With the cure, always, worse than the disease. Perhaps, by design.
SEE for yourself the magnitude of epic, global warming climate change predictions of doom, throughout the decades, that have not eventuated :
The Extinction Clock “Welcome to the Extinction Clock. Any time we hear of a credible prediction of doom, we’ll be sure to add it to the list!”
•••
OZONE related :
The Ozone Scare Was A Dry Run For The Global Warming Scare | Watts Up With That?
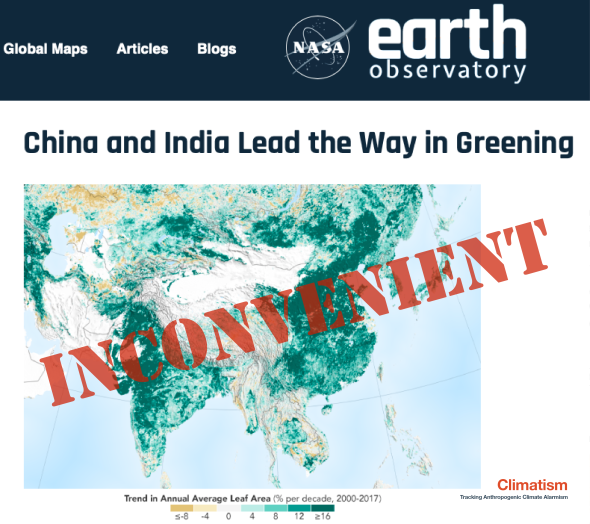
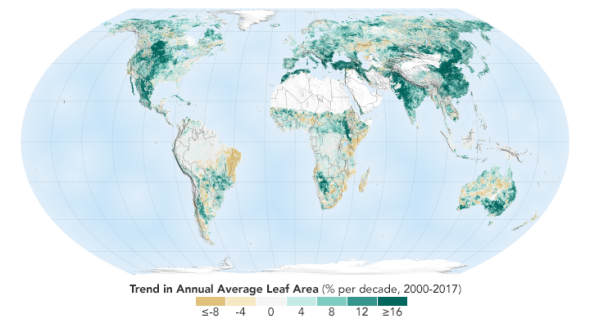
China and India Lead the Way in Greening | NASA (Climatism edit)
“The fact that an opinion has been widely held is no evidence whatever that it is not utterly absurd; indeed in view of the silliness of the majority of mankind, a widespread belief is more likely to be foolish than sensible.”– Bertrand Russel
***
DON’T expect to see this ‘good’ environmental news on the mainstream media anytime soon.
WHEN you’re in the business of demonising carbon dioxide and frightening the Thunberg’s kiddies for political and ideological ends, such good news comes as a rather unwelcome message!
Via NASA Earth Observatory :
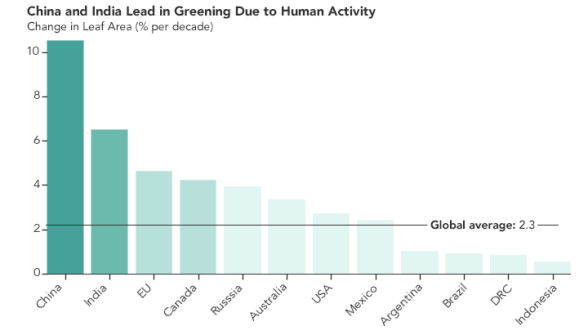
China and India Lead the Way in Greening
The world is literally a greener place than it was twenty years ago, and data from NASA satellites has revealed a counterintuitive source for much of this new foliage. A new study shows that China and India—the world’s most populous countries—are leading the increase in greening on land. The effect comes mostly from ambitious tree-planting programs in China and intensive agriculture in both countries.
Ranga Myneni of Boston University and colleagues first detected the greening phenomenon in satellite data from the mid-1990s, but they did not know whether human activity was a chief cause. They then set out to track the total amount of Earth’s land area covered by vegetation and how it changed over time.
The research team found that global green leaf area has increased by 5 percent since the early 2000s, an area equivalent to all of the Amazon rainforests. At least 25 percent of that gain came in China. Overall, one-third of Earth’s vegetated lands are greening, while 5 percent are growing browner. The study was published on February 11, 2019, in the journal Nature Sustainability.
The maps on this page show the increase or decrease in green vegetation—measured in average leaf area per year—in different regions of the world between 2000 and 2017. Note that the maps are not measuring the overall greenness, which explains why the Amazon and eastern North America do not stand out, among other forested areas.
“China and India account for one-third of the greening, but contain only 9 percent of the planet’s land area covered in vegetation,” said lead author Chi Chen of Boston University. “That is a surprising finding, considering the general notion of land degradation in populous countries from overexploitation.”
globalgreening_tamo_2017
This study was made possible thanks to a two-decade-long data record from the Moderate Resolution Imaging Spectroradiometer (MODIS) instruments on NASA’s Terra and Aqua satellites. An advantage of MODIS is the intensive coverage they provide in space and time: the sensors have captured up to four shots of nearly every place on Earth, every day, for the past 20 years.
“This long-term data lets us dig deeper,” said Rama Nemani, a research scientist at NASA’s Ames Research Center and a co-author of the study. “When the greening of the Earth was first observed, we thought it was due to a warmer, wetter climate and fertilization from the added carbon dioxide in the atmosphere. Now with the MODIS data, we see that humans are also contributing.”
China’s outsized contribution to the global greening trend comes in large part from its programs to conserve and expand forests (about 42 percent of the greening contribution). These programs were developed in an effort to reduce the effects of soil erosion, air pollution, and climate change.
Another 32 percent of the greening change in China, and 82 percent in India, comes from intensive cultivation of food crops. The land area used to grow crops in China and India has not changed much since the early 2000s. Yet both countries have greatly increased both their annual total green leaf area and their food production in order to feed their large populations. The agricultural greening was achieved through multiple cropping practices, whereby a field is replanted to produce another harvest several times a year. Production of grains, vegetables, fruits and more have increased by 35 to 40 percent since 2000.
countrieschart_tamo_2017
How the greening trend may change in the future depends on numerous factors. For example, increased food production in India is facilitated by groundwater irrigation. If the groundwater is depleted, this trend may change. The researchers also pointed out that the gain in greenness around the world does not necessarily offset the loss of natural vegetation in tropical regions such as Brazil and Indonesia. There are consequences for sustainability and biodiversity in those ecosystems beyond the simple greenness of the landscape.
Nemani sees a positive message in the new findings. “Once people realize there is a problem, they tend to fix it,” he said. “In the 1970s and 80s in India and China, the situation around vegetation loss was not good. In the 1990s, people realized it, and today things have improved. Humans are incredibly resilient. That’s what we see in the satellite data.”
NASA Earth Observatory images by Joshua Stevens, using data courtesy of Chen et al.,(2019). Story by Abby Tabor, NASA Ames Research Center, with Mike Carlowicz, Earth Observatory.
*
GLOBAL GREENING…
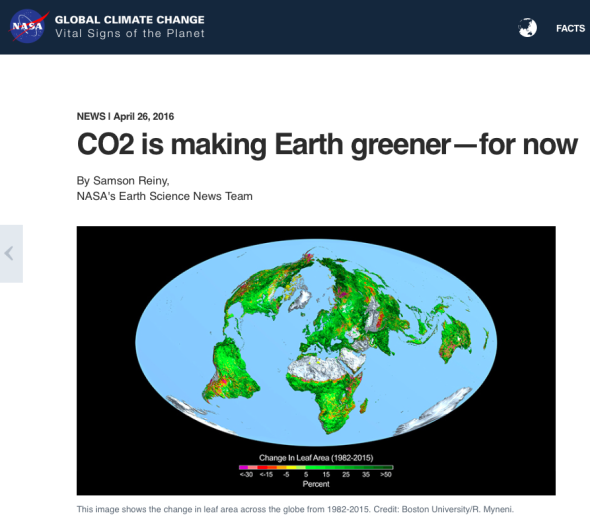
“A quarter to half of Earth’s vegetated lands has shown significant greening over the last 35 years largely due to rising levels of atmospheric carbon dioxide, according to a new study published in the journal Nature Climate Change on April 25.” – NASA
NASA previously reported on the ‘greening of the earth’ thanks to the CO2 ‘fertilisation’ effect.
HOWEVER, such good news was again carefully omitted by the mainstream media and environmental activists keen to preserve their ‘catastrophic’ global warming climate change narrative and continue their demonisation of life-giving gas carbon dioxide, deceptively referring to it as “carbon pollution” :
“A quarter to half of Earth’s vegetated lands has shown significant greening over the last 35 years largely due to rising levels of atmospheric carbon dioxide, according to a new study published in the journal Nature Climate Change on April 25.” – NASA
CO2 is making Earth greener—for now – Climate Change: Vital Signs of the Planet
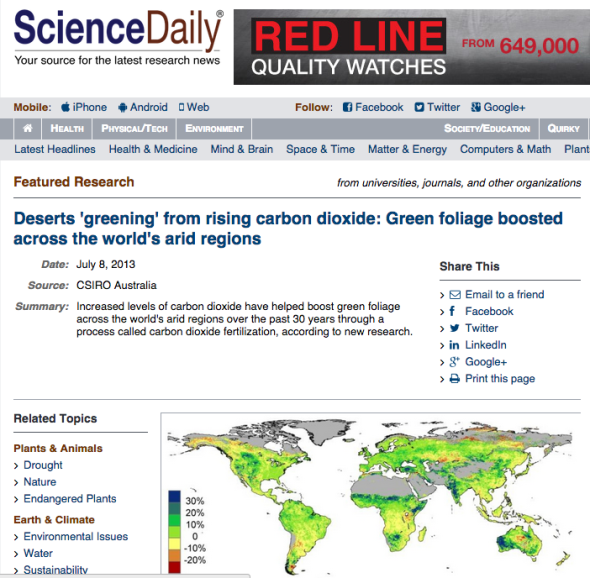
IN 2013, the CSIRO commissioned a study that found “Deserts ‘greening’ from rising carbon dioxide: Green foliage boosted across the world’s arid regions.”
THE ‘greening’ of deserts, thanks to rising CO2, happens to be a very unwelcome message for the environmental movement and apparently for the CSIRO, too! So, they simply removed the study from their website!
THE Climate Change Scam : Death By GIF | CLIMATISM
“Kevin and I will keep [skeptic papers] out [of IPCC] somehow – even if we have to redefine what peer-review literature is.”
– Phil Jones to Michael Mann | Climategate Emails
“As you know, I’m not political. If anything, I would like to see the climate change happen, so the science could be proved right, regardless of the consequences. This isn’t being political, it is being selfish.” –Phil Jones (Uni East Anglia CRU Head)
“The data doesn’t matter. We’re not basing our recommendations
on the data. We’re basing them on the climate models.”
– Prof. Chris Folland,
Hadley Centre for Climate Prediction and Research
THE “Hottest Year Ever” meme is just one in a long line of propaganda tools used by the Climate Crisis Industry to make you believe that the 1°C rise in global temperature since the end of the Little Ice Age – around 1880 – is “unprecedented” and will bring chaos to wildlife, humans and the planet.
HOW much of these claims are scientific, versus propaganda designed to heighten alarm around the agenda of catastrophic anthropogenic global warming (CAGW), is the centre of much conjecture and debate.
OF particular concern is how a handful of government climate ‘scientists’ have ‘homogenised’ the official surface-based temperature records to land us in the costly, hot mess we face today.
*
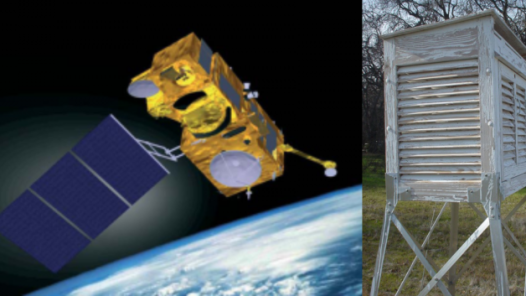
SATELLITES Vs THERMOMETERS?
*
ATMOSPHERIC SATELLITES
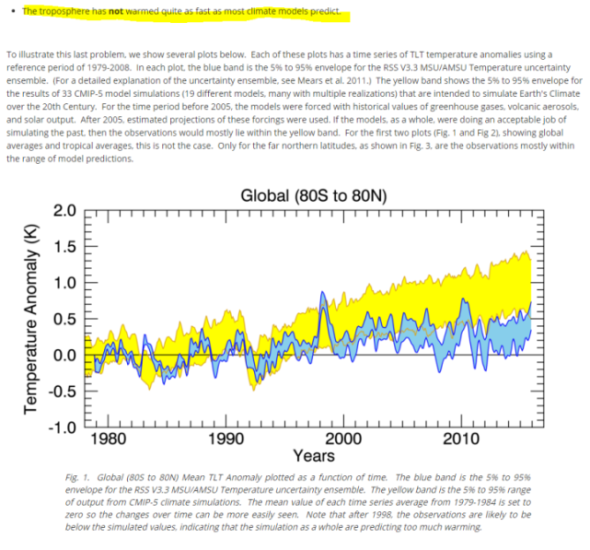
NASA’s 15 MSU and AMSU satellites generate the RSS and UAH datasets, which measure the average temperature of every cubic inch of the lower troposphere, the exact place where global warming climate change theory is meant to occur.
BEFORE 2016, UAH and RSS both tracked closely showing very little warming in their data sets which led to the identification and validation of “the pause” in global warming which has since become the subject of much research and debate in peer-reviewed scientific journals.
From the RSS website:
“The simulation as a whole are predicting too much warming” – RSS
Source: http://www.remss.com/research/climate Archived here – http://www.webcitation.org/6fiQcrQDQ
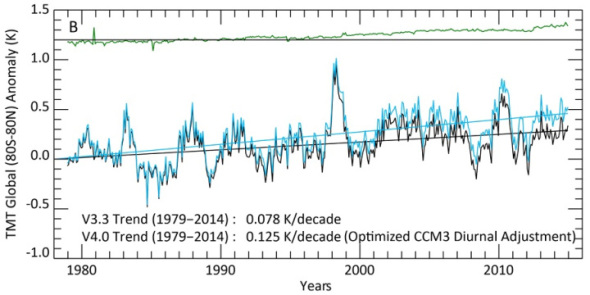
HOWEVER, by 2016, Carl Mears, chief scientist for RSS (Remote Sensing Systems) decided that the lengthy and inconvenient global warming “pause” or “hiatus” was not a good look for the global warming narrative, so RSS was adjusted upwards, eliminating “the pause”.
Differences between the old version and new version of RSS:
Fig. 8. Comparison between RSS V3.3 global (80°S to 80°N) anomaly time series, and result from the V4.0 merging algorithm with different levels of adjustments applied.
MEARS’ objectivity towards the business of global temperature data collection and reporting can be found in his commentary on his website, whilst making his global-warmist intentions clear by unleashing the groupthink pejorative “denialist” – in distasteful reference to NAZI holocaust denial…
MEARS then published a paper claiming that new and improved ‘adjustments’ had “found” that missing warming.
Mears, C., and F. Wentz, 2016: Sensitivity of satellite-derived tropospheric temperature trends to the diurnal cycle adjustment. J. Climate. doi:10.1175/JCLID- 15-0744.1, in press.
FOR the purpose of this post, we’ll look at the untampered UAH (University Alabama Huntsville) satellite data set run by Dr. John R. Christy – Distinguished Professor of Atmospheric Science and Director of the Earth System Science Center at The University of Alabama in Huntsville, and Roy Spencer Ph.D. – Principal Research Scientist at UAH.
SPENCER comments on the divergence between RSS and UAH post “adjustment”:
“We have a paper in peer review with extensive satellite dataset comparisons to many balloon datasets and reanalyses. These show that RSS diverges from these and from UAH, showing more warming than the other datasets between 1990 and 2002 – a key period with two older MSU sensors both of which showed signs of spurious warming not yet addressed by RSS. I suspect the next chapter in this saga is that the remaining radiosonde datasets that still do not show substantial warming will be the next to be “adjusted” upward.
The bottom line is that we still trust our methodology. But no satellite dataset is perfect, there are uncertainties in all of the adjustments, as well as legitimate differences of opinion regarding how they should be handled.
Also, as mentioned at the outset, both RSS and UAH lower tropospheric trends are considerably below the average trends from the climate models.
And that is the most important point to be made.”
Comments on the New RSS Lower Tropospheric Temperature Dataset « Roy Spencer, PhD
(Climatism bolds)
*
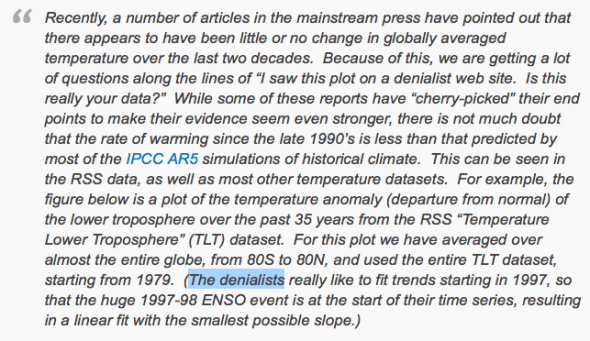
DECEMBER 2018 UAH TEMPERATURE ANOMALY
GLOBAL atmospheric temperatures continue their rapid decline off the record heights of the 2015/16 super El Niño, despite record and rising CO2 emissions.
UAH global average lower tropospheric temperature (LT) anomaly for December, 2018 was +0.25°C above the 40-year average:
uah_lt_1979_thru_december_2018_v6-550×317
*
RECORD 2-YEAR GLOBAL TEMPERATURE DROP (HadCRUT4)
GLOBAL temperature dropped by a record 0.4°C in three years according to U.K. HadCRUT4 temperature data set:
Earth in ‘Greatest Two-Year Cooling Event in a Century’ Shock
Our planet has just experienced the most extreme two-year cooling event in a century. But where have you seen this reported anywhere in the mainstream media?
You haven’t, even though the figures are pretty spectacular. As Aaron Brown reports hereat Real Clear Markets:
From February 2016 to February 2018 (the latest month available) global average temperatures dropped 0.56°C. You have to go back to 1982-84 for the next biggest two-year drop, 0.47°C—also during the global warming era. All the data in this essay come from GISTEMP Team, 2018: GISS Surface Temperature Analysis (GISTEMP). NASA Goddard Institute for Space Studies (dataset accessed 2018-04-11 at https://data.giss.nasa.gov/gistemp/). This is the standard source used in most journalistic reporting of global average temperatures.
The 2016-18 Big Chill was composed of two Little Chills, the biggest five month drop ever (February to June 2016) and the fourth biggest (February to June 2017). A similar event from February to June 2018 would bring global average temperatures below the 1980s average. February 2018 was colder than February 1998.
To put this temperature drop in context, consider that this is enough to offset by more than half the entirety of the global warming the planet has experienced since the end of the 19th century.
Read the rest on Breitbart.
*
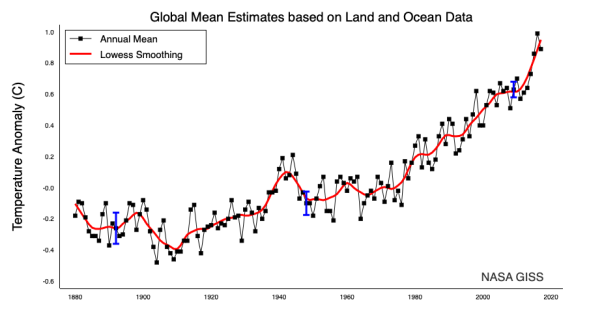
LAND-BASED THERMOMETERS
NASA GLOBAL LAND & OCEAN TEMPERATURE ANOMALY
Global Mean Estimates based on Land and Ocean Data:
Data.GISS: GISS Surface Temperature Analysis: Analysis Graphs and Plots
*
NASA LAND & OCEAN TEMP DATA OBSERVATIONS :
THE 20 year global warming “Pause” has been well and truly wiped from the NASA GISS temperature record. AS has the record 2-year temperature drop, post 2015/16 El Niño – according to NASA GISS data.
BY their own admission, the ocean data is also fake.
date: Wed Apr 15 14:29:03 2009
from: Phil Jones <p.jones@uea.ac.uk> subject: Re: Fwd: Re: contribution to RealClimate.org
to: Thomas Crowley <thomas.crowley@ed.ac.uk>
Tom,
The issue Ray alludes to is that in addition to the issue
of many more drifters providing measurements over the last
5-10 years, the measurements are coming in from places where
we didn’t have much ship data in the past. For much of the SH between 40 and 60S the normals are mostly made up as there is very little ship data there.
Cheers
Phil
di2.nu/foia/foia2011/mail/2729.txt
***
CLIMATE CHANGE DATA FRAUD : Death By Gif(s)
“HE who controls the past controls the future. He who controls the present controls the past.” – George Orwell
NOW it’s time to see how NASA GISS (Gavin Schmidt) and NOAA (Tom Karl) have created the ‘hockey-stick’ temperature rise over recent years in order to drive the Mann-made global warming agenda.
MIND-blowing adjustments to raw data that without exception – cool the past and warm the present – despite UHI (Urban Heat Island effect) undoubtedly compromising the latter parts of the modern temp record.
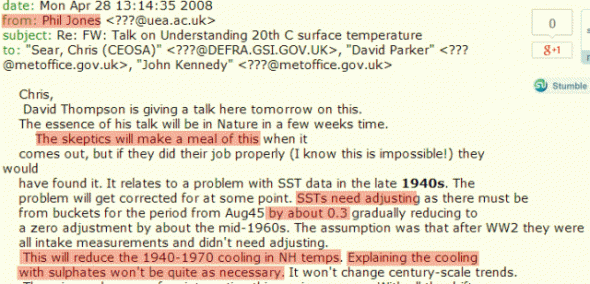
AND, if you think that the tampering of the earth’s temperature record, by cooling the past and warming the present to fit the man-made global warming narrative is another climate “denier” conspiracy theory then read this Climategate email from the UK’s leading climate expert, Phil Jones, to the UK Met Office and officials:
GLOBAL WARMING Is The Greatest And Most Successful Pseudoscientific Fraud In History | Climatism
THE problem of the 1940’s warming “blip” :
THEY did exactly what Wigley was suggesting, removing more than 0.15 C from 1940′s global temperatures. This tampering is what made the hockey stick possible.
If the present refuses to get warmer, then the past must become cooler …
Motherlode Part III | Real Science
*
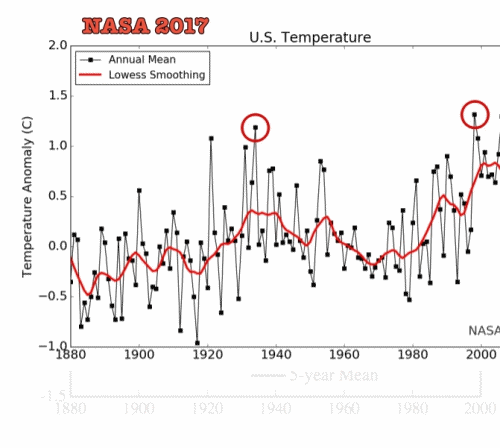
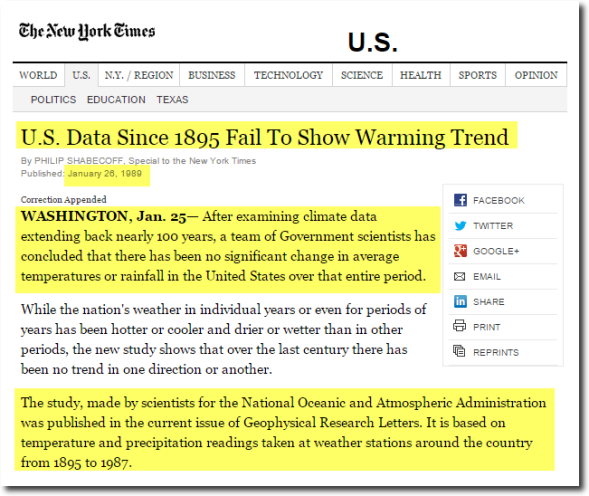
U.S. TEMPERATURE RECORD
THE lack of US warming wrecks global warming theory, so NOAA and NASA reduced the “1940’s Blip” in the US record to create fake warming:
1999 Version 2017 Version
NOAA knows perfectly well that the US is not warming:
U.S. Data Since 1895 Fail To Show Warming Trend – NYTimes.com
*
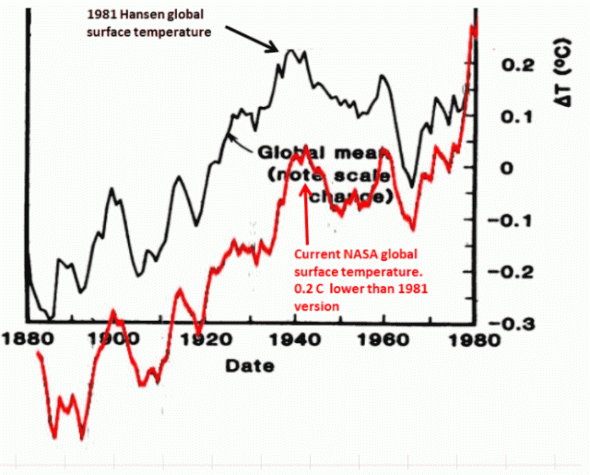
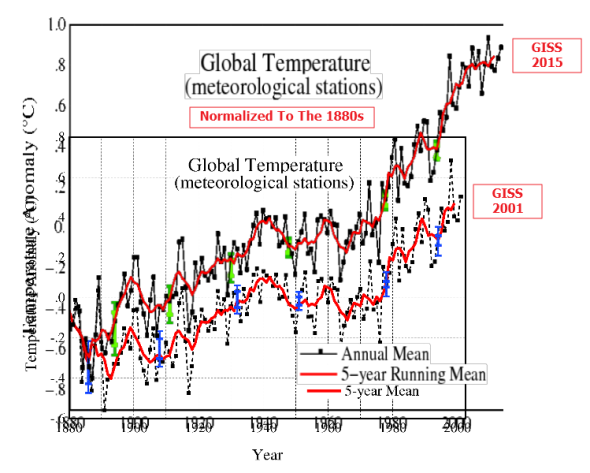
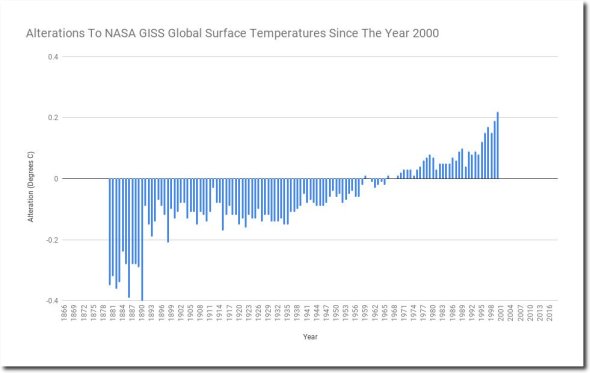
GLOBAL TEMPERATURE RECORD
NASA has doubled global warming since 2001:
NASA Global Temperature ‘Adjustments’
NASA Global Land-Ocean Temperature ‘Adjustments’
*
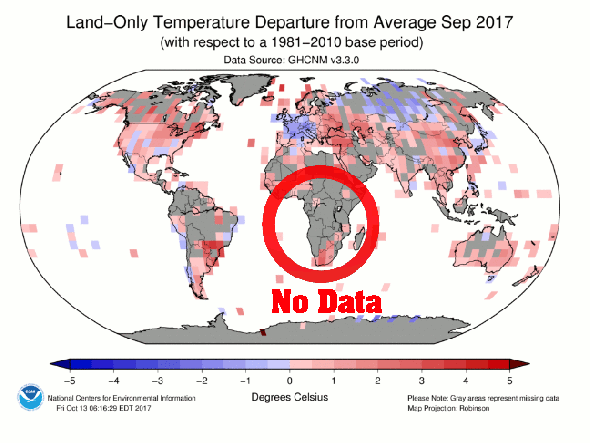
“HOTTEST YEAR EVAHH”
NASA make up record temperatures in countries where they have no thermometer data. NOAA’s current data in Africa and much of the rest of the world is fake.
THIS enables them to make the fake “Hottest Year Ever” announcements. Memes that have more to do with PR and marketing than actual science:
Real temperatures Reported temperatures
*
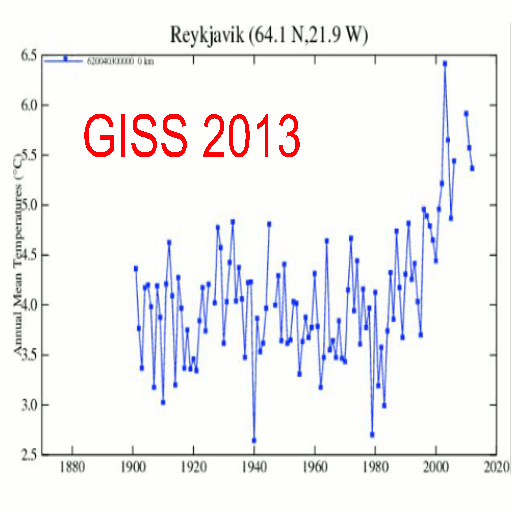
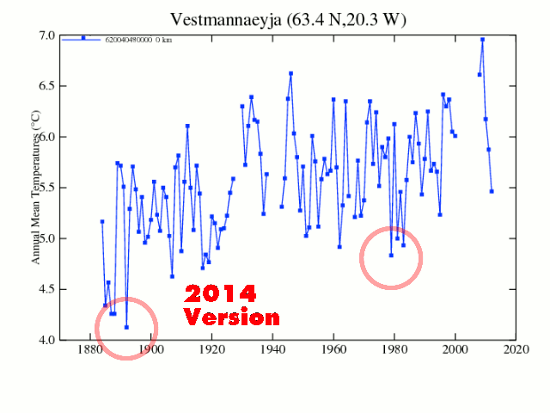
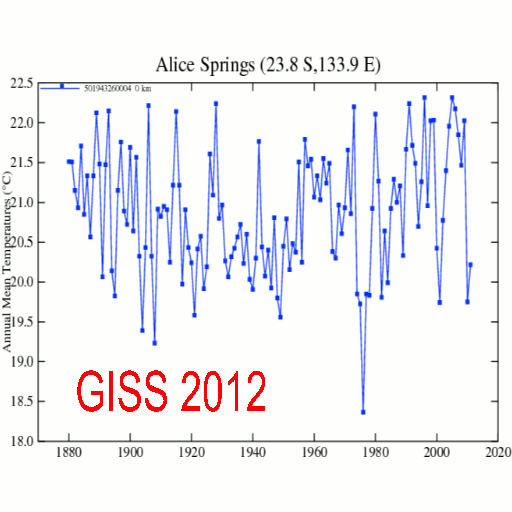
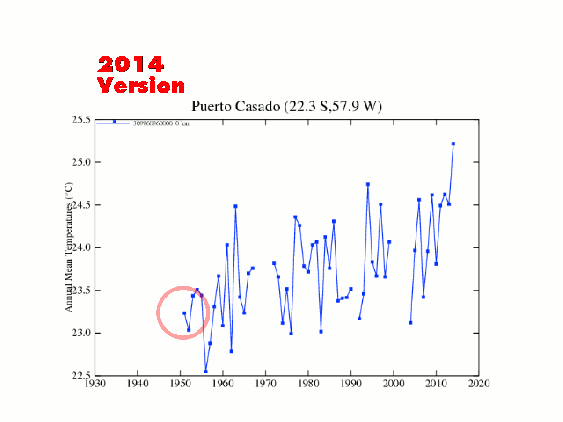
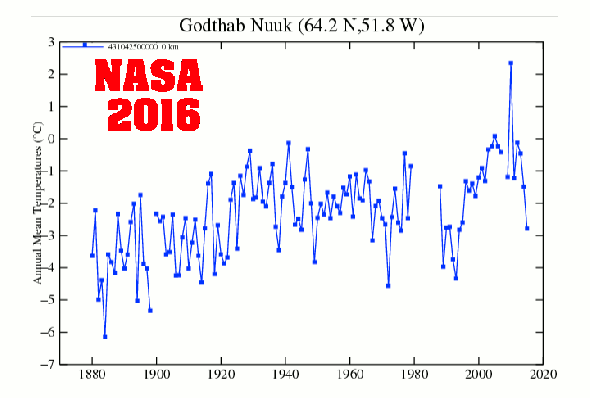
ERASING “THE BLIP” – VARIOUS LOCATIONS
Changes to GISS Iceland temperatures between V2 and V3
NASA didn’t like the 1940’s warmth in Greenland, so they simply made it disappear:
((SEE more extreme examples of NASA / NOAA temperature data fraud at Tony Heller’s superb resource: The Deplorable Climate Science Blog | “Science is the belief in the ignorance of the experts” – Richard Feynman))
(Charts via Tony Heller “Real Climate Science”)
*
UPDATE
THE NASA global temperature record has been massively altered over the last 20 years to cool the past and warm the present:
Steve Goddard on Twitter: “The @NASA global temperature record has been massively altered over the last 20 years to cool the past and warm the present.…”
*
NASA GISS : THE DATA SET OF CHOICE FOR THE CLIMATE THEORY OBSESSED MAINSTREAM MEDIA & POLITICAL ELITE!
IT’s not difficult to see why the NASA GISS data set is the preferred go-to for global warming activists, mainstream media, the UN IPCC and virtue-peddling politicians seeking to destroy cheap, efficient energy supply – namely coal-fired power – through the implementation of draconian climate change policy, and proposals like the U.S. Democrats’ “New Green Deal”, that if implemented will annihilate both the U.S. and the global economy and result in total control of every aspect of your life, lifestyle and any freedoms you currently enjoy.
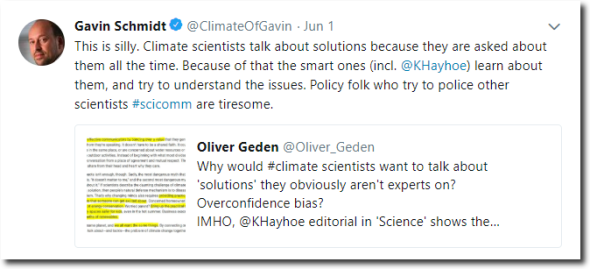
NASA GISS’ Gavin Schmidt wants to use his junk science to control public policy, and says questions from policy makers are “tiresome” :
Shocking Twitter Display Of Contempt And Hubris By Stefan Rahmstorf, NASA’s Gavin Schmidt
*
PRESIDENT EISENHOWER WARNED US OF THE “danger that public policy could itself become the captive of a scientific-technological elite.”
“The prospect of domination of the nation’s scholars by Federal employment, project allocations, and the power of money is ever present — and is gravely to be regarded.
Yet, in holding scientific research and discovery in respect, as we should, we must also be alert to the equal and opposite danger that public policy could itself become the captive of a scientific-technological elite.”
President Eisenhower January 17, 1961
*
CONCLUSION
FOR so long, climate ‘sceptics’ have been labeled climate/science “deniers”, in crude reference to those who deny the holocaust, with the pejorative used in a broader effort to shut down debate and silence dissent. However, when hard evidence is laid out over alarmist rhetoric, it’s not hard to see who in fact are the real deniers of history and indeed, deniers of science.
EVEN when hard data, “the science” and empirical evidence completely contradict alarmist predictions and forecasts peddled by the mainstream media and grant-driven ‘scientists’, alarmists continue to double-down on their fear-mongering instead of evaluating their theory, adhering to the “scientific method” and admitting that they might just have got it all wrong.
*
GLOBAL WARMING dogma has ruinously snowballed into a $TRILLION dollar religion to be defended at all costs by alarmist ‘scientists’, UNreliables rent-seekers and the climate theory-obsessed mainstream media in order to protect egos, jobs, reputations and access to unlimited “Save The Planet” taxpayer trillions, completely immune to oversight.
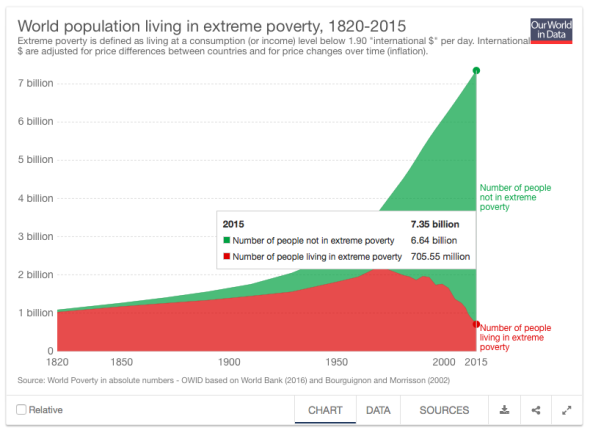
TIME to stop the rot for the sake of “science” and Western civilisation that has given us so much to be thankful for, like the dramatic drop in global poverty. Primarily due to the deployment of cheap, reliable and abundant hydrocarbon fuels. Life-giving and poverty-reducing energy sources that the zero-emissions zealots want to replace with sunshine and breezes, forcing us backwards down the energy ladder to the days of human, animal and solar power.
JUST as socialist central planning failed miserably before it was replaced by free market economies, green central planning will have to be discarded before Australia and other Western nations, crippled by the mad rush into costly and ruinous UNreliables, will see a return to energy security, competitive pricing and a ‘liveable’ existence for our most vulnerable.
LIKEWISE, climate data fraud must be called out and crushed with the scientific method restored to allay dangerous and costly climate change fear and alarmism.
CO2 not a fan of the countryside! It clearly prefers “polluting” inner urban greens and warming alarmists with UHI!
Climate Collections
From NoTricksZone.com
By P Gosselin on 15. August 2018
Guest post by Kirye in Tokyo
An analysis of the rural-sited Japanese weather stations used by the Japanese Meteorological Agency (JMA) shows there’s been no warming at all over the the past 2 decades or more.
Strangely many of these stations, which are practically unimpacted by data-corruptive urban sprawl, are no longer used by NASA.
For example, NASA quit using the rural Fukaura station back in 1990. Up to that point Fukaura was cooling notably. What follows is the NASA chart for Fukaura:
Fukaura showed cooling before NASA dropped the station in 1990. Image: NASA
The same, for example, is true for Nikko.
NASA dropped rural Japanese stations
What follows below is a list of the rural stations I examined, which have a Brightness Index (BI) of 10 or less. The far right column shows the period they were used by…
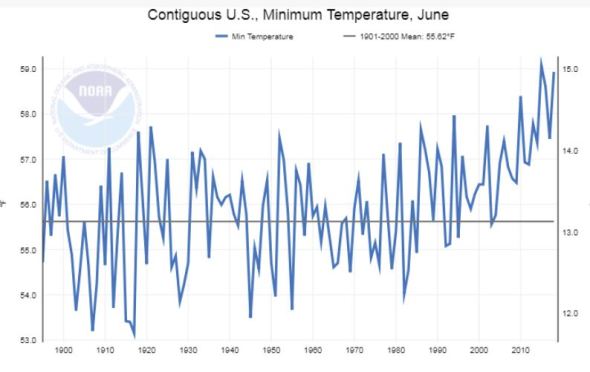
“And by hottest i mean Maximum Temperature. Globalists use Average Temps because minimums are skyrocketing because of UHI.”
THIS is such an underestimated, ‘inconvenient’ and non-reported fact about average global temps as well, in particular land-based GHCN/NOAA station data polluted by UHI.
INSTEAD of ‘adjusting’ out the 1-3C differences between urban and rural station data in the latter half of 20th century raw data, agencies like NASA GISS are cooling the past, namely the as warm 1930’s as seen in the US T-max temps in this post. The exact opposite of the adjustments that they should be making to correct UHI caused by urban sprawl.
NOT hard to understand why Govt agencies like NASA GISS wipe out the hot 1930’s and leave the UHI polluted current temps – because there would be no man-made “global warming” aka “climate change” problem if todays temps are the same, if not cooler, than the extreme 1930’s temps before human emissions could have had any significant effect on climate.
“We’ve got to ride this global warming issue.
Even if the theory of global warming is wrong,
we will be doing the right thing in terms of
economic and environmental policy.“ – Timothy Wirth, President of the UN Foundation
“It’s very hard to see us fixing the climate, until we fix our democracy.” – James Hansen
“I believe it is appropriate to have an ‘over-representation’ of the facts
on how dangerous it is, as a predicate for opening up the audience.” – Al Gore
“The whole aim of practical politics is to keep the populace alarmed (and hence clamorous to be led to safety) by menacing it with an endless series of hobgoblins, all of them imaginary.” – HL Mencken
*
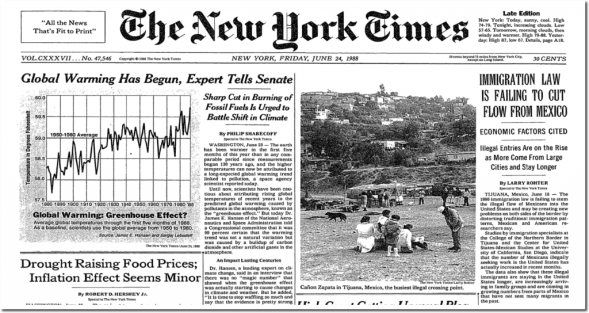
IT’S been 30 years since former NASA climate director James E. Hansen, sponsored by Democrat senator Timothy Wirth, made his ‘stage-crafted’ testimony to the U.S. Senate proclaiming that human emissions were dangerously heating the planet.
IT was Hansen’s testimony – made on a sweltering summer’s day during then the hottest year on record – that put climate change on the front page of newspapers.
Global Warming Has Begun, Expert Tells Senate – The New York Times
THAT day was by far the hottest June 22 on record in the US, with almost the entire country over 90 degrees and much of the country over 100 degrees… Read the rest of this entry »
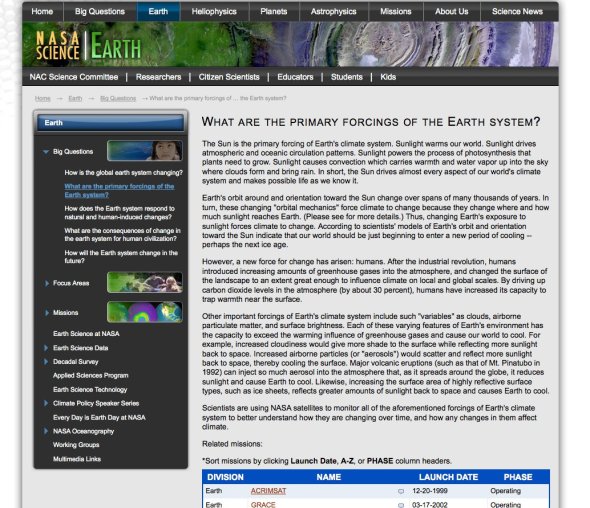
AND, before the new-NASA-activists rewrote climate ‘science’, the National Aeronautics Space Agency boldly (and correctly) noted that “Other important forcings of Earth’s climate system” such as “clouds, airborne particulate matter, and surface brightness [have] the capacity to exceed the warming influence of greenhouse gases and cause our world to cool.”
NASA – It’s The Sun Stupid!
FROM the above NASA article that disappeared around 2010 :
WHAT ARE THE PRIMARY FORCINGS OF THE EARTH SYSTEM?
The Sun is the primary forcing of Earth’s climate system. Sunlight warms our world. Sunlight drives atmospheric and oceanic circulation patterns. Sunlight powers the process of photosynthesis that plants need to grow. Sunlight causes convection which carries warmth and water vapor up into the sky where clouds form and bring rain. In short, the Sun drives almost every aspect of our world’s climate system and makes possible life as we know it.
Earth’s orbit around and orientation toward the Sun change over spans of many thousands of years. In turn, these changing “orbital mechanics” force climate to change because they change where and how much sunlight reaches Earth. Thus, changing Earth’s exposure to sunlight forces climate to change. According to scientists’ models of Earth’s orbit and orientation toward the Sun indicate that our world should be just beginning to enter a new period of cooling — perhaps the next ice age.
However, a new force for change has arisen: humans. After the industrial revolution, humans introduced increasing amounts of greenhouse gases into the atmosphere, and changed the surface of the landscape to an extent great enough to influence climate on local and global scales. By driving up carbon dioxide levels in the atmosphere (by about 30 percent), humans have increased its capacity to trap warmth near the surface.
Other important forcings of Earth’s climate system include such “variables” as clouds, airborne particulate matter, and surface brightness. Each of these varying features of Earth’s environment has the capacity to exceed the warming influence of greenhouse gases and cause our world to cool. For example, increased cloudiness would give more shade to the surface while reflecting more sunlight back to space. Increased airborne particles (or “aerosols”) would scatter and reflect more sunlight back to space, thereby cooling the surface. Major volcanic eruptions (such as that of Mt. Pinatubo in 1992) can inject so much aerosol into the atmosphere that, as it spreads around the globe, it reduces sunlight and cause Earth to cool. Likewise, increasing the surface area of highly reflective surface types, such as ice sheets, reflects greater amounts of sunlight back to space and causes Earth to cool.
Scientists are using NASA satellites to monitor all of the aforementioned forcings of Earth’s climate system to better understand how they are changing over time, and how any changes in them affect climate.
ACCORDING to NASA data, the recent 0.56°C plunge in global temperatures, following the 2015/16 super El Niño, is the greatest two-year cooling event in a century. “You have to go back to 1982-84 for the next biggest two-year drop, 0.47°C—also during the global warming era.”
NASA’s MSU satellite measurement systems, generate the RSS and UAH datasets, which measure the average temperature of every cubic inch of the lower atmosphere (0-10 kms), the exact place where global warming theory is meant to occur.
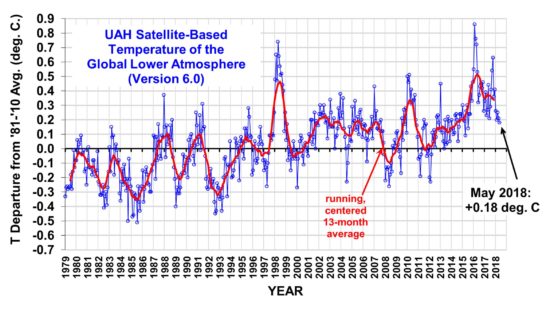
MAY TEMPS +0.18C ABOVE AVERAGE
GLOBAL temps continue their cooling trend, rebounding off the 2015/16 Super El Niño – the strongest since accurate measurements began, caused by surface waters in the Pacific Ocean, west of Central America rising up to 3C warmer than usual.
GREENHOUSE GAS THEORY CHECK?
THE latest UAH V6.0 May anomaly of +0.18 brings temperatures back to the levels they were at the beginning of the Century, reinforcing the current 18+ year global warming “pause”, despite record and rising CO2 emissions…
UAH Global Temperature Update for May, 2018- +0.18 deg. C « Roy Spencer, PhD
Latest Global Average Tropospheric Temperatures
Since 1979, NOAA satellites have been carrying instruments which measure the natural microwave thermal emissions from oxygen in the atmosphere. The intensity of the signals these microwave radiometers measure at different microwave frequencies is directly proportional to the temperature of different, deep layers of the atmosphere. Every month, John Christy and I update global temperature datasets that represent the piecing together of the temperature data from a total of fifteen instruments flying on different satellites over the years. A discussion of the latest version (6.0) of the dataset is located here.
The graph above represents the latest update; updates are usually made within the first week of every month. Contrary to some reports, the satellite measurements are not calibrated in any way with the global surface-based thermometer records of temperature. They instead use their own on-board precision redundant platinum resistance thermometers (PRTs) calibrated to a laboratory reference standard before launch.
Latest Global Temps « Roy Spencer, PhD
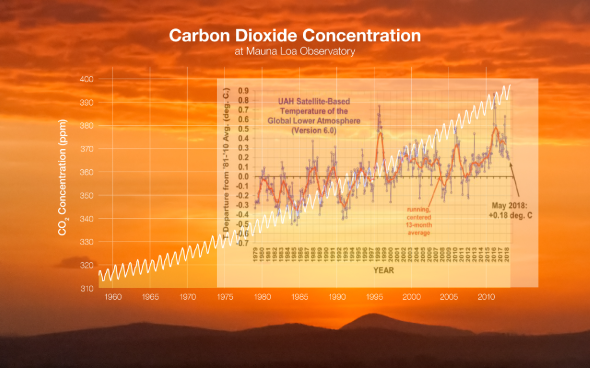
CO2 CONCENTRATION Vs TEMPS – Correlation?
CO2 Vs Temp Correlation 1979-2018 CLIMATISM
*
GLOBAL TEMPERATURE MEASUREMENTS – JUDGE FOR YOURSELF!
Satellites Vs Thermometers?
*
SATELLITES
NASA’s MSU satellite measurement systems, generate the RSS and UAH datasets, which measure the average temperature of every cubic inch of the lower atmosphere, the exact place where global warming theory is meant to occur. Read the rest of this entry »
“CLIMATE alarmism is a gigantic fraud: it only survives by suppressing dissent and by spending tens of billions of dollars of public money every year on pseudo-scientific propaganda.” – Leo Goldstein
EXCESSIVE or exaggerated alarm about a real or imagined threat is fundamental in driving the human CO2-induced global warming climate change narrative.
THE most popular climatic and weather-related events, as marketed by the Climate Crisis Industry, fall well within the bounds of natural variability. So, in order for such events to make the headlines, attract taxpayer funding for ‘research’, and advance the misanthropic, man-made climate change agenda, they must be accompanied by inflated language, an urgent tone, imagery of doom, and in many cases, fraudulent data.
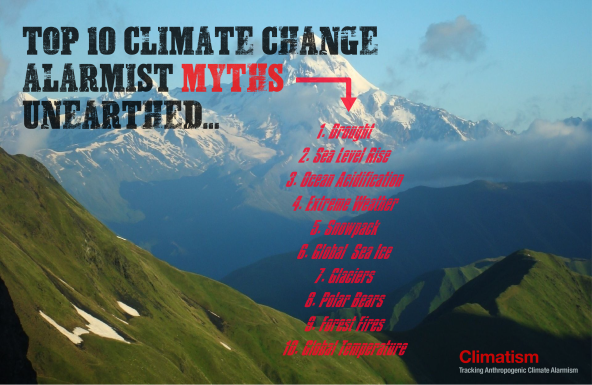
IN this series we take an objective/sceptical look at ten of the more popular metrics used by warming alarmists to push the CAGW (catastrophic anthropogenic global warming) narrative, testing the veracity of the all-too-often wild and alarmist claims associated with each…
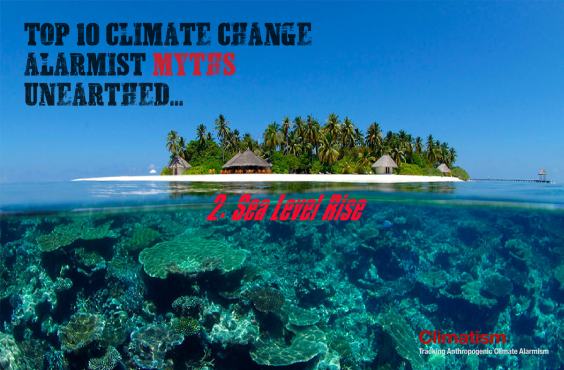
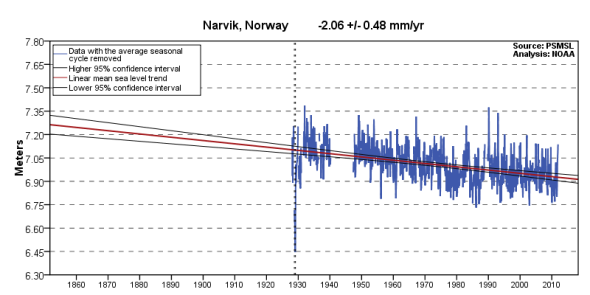
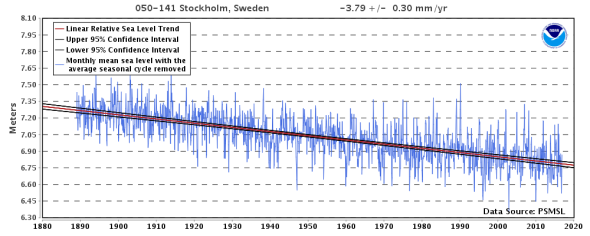
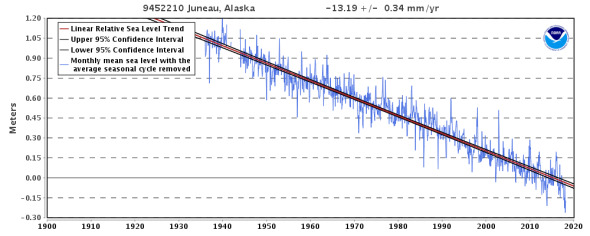
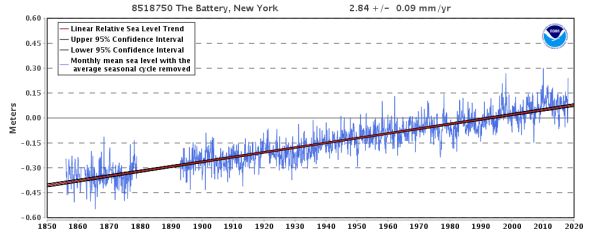
#2. SEA LEVEL RISE
“THE Seas Are Rising”! You’ve read it, seen it and heard about it just about everywhere in conjunction with the climate change debate. However, the very statement “rising sea levels” is deceptive from the start.
SEA-levels both rise and fall depending on where you are on the planet. Absolute sea-level varies from negative to positive to stabledepending on a range of regional factors including: local vertical land motion, land use, salinity, regional ocean circulations, ocean heat content and tidal variations…
Relative Sea Level Trend 8518750 The Battery, New York – NOAA Tides & Currents
Relative Sea Level Trend
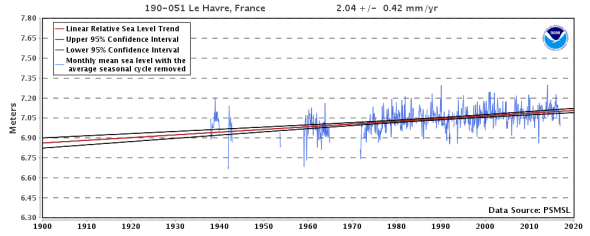
Le Havre, France
Sea Level Trends – Relative Sea Level Trend 190-051 Le Havre, France – NOAA Tides & Currents
*
STABLE
REMEMBER the “sinking” Pacific Island nations…
THE climate-theory-obsessed mainstream media has gleefully pawned the emotional link between climate change and ‘sinking’ tropical islands to push their man-made global warming agenda…
“The tiny pacific island nation of Tuvalu looks set to become a victim of global warming, with the entire country predicted to be washed away in 50 years.”(BBC 2002)
TUVALU’s plight even formed part of the basis for arguably the most hysterical fake news claim in the history of climate alarmism: the UN’s prediction that by the end of 2010, climate change would have created “50 million environmental refugees”!
CLIMATISM, along with the climate sceptic “denier” community have been citing actual scientific data and empirical observations that have consistently contradicted the hysterical claims made by the mainstream media of “drowning island nations” for years…
Relative Sea Level Trend
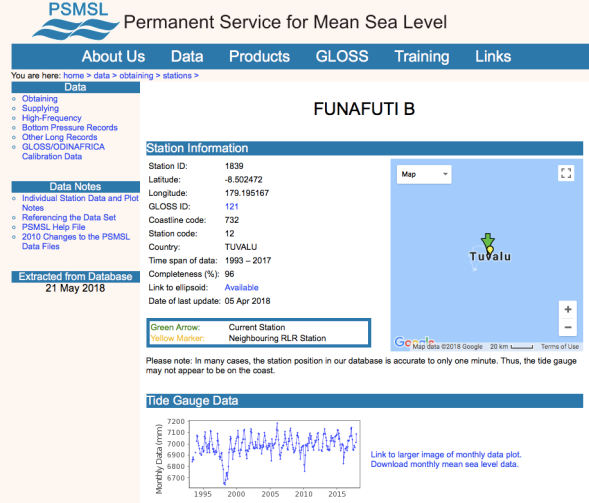
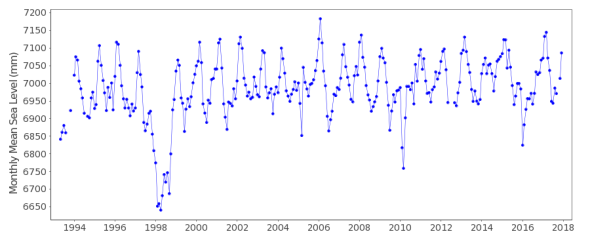
Funafati B, Tuvalu
Data and Station Information for FUNAFUTI B
Data and Station Information for FUNAFUTI B
The sinking island nation of Tuvalu is actually growing | Inhabitat


 The Extinction Clock “Welcome to the Extinction Clock. Any time we hear of a credible prediction of doom, we’ll be sure to add it to the list!”


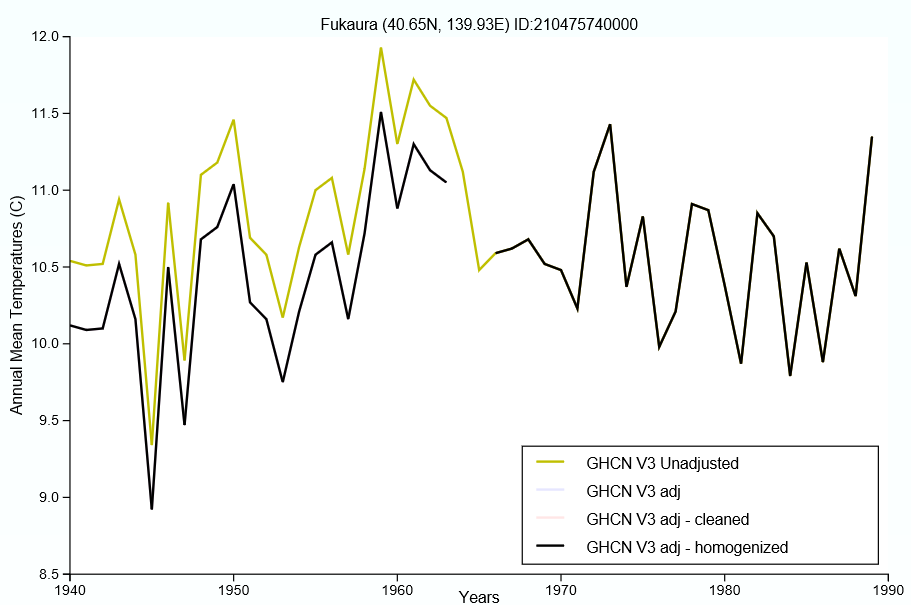 Fukaura showed cooling before NASA dropped the station in 1990. Image: NASA
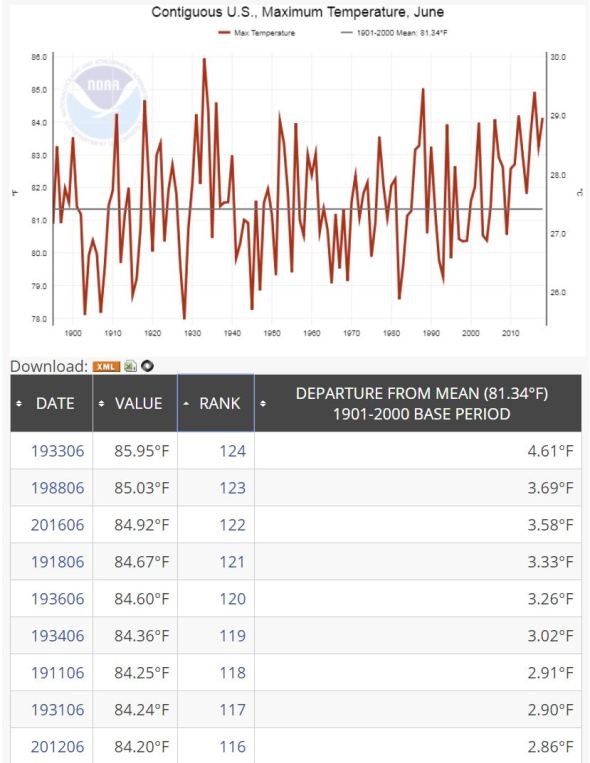


Recent Comments