
“THE PAUSE” Lives On : Global Temperatures Continue To Cool Despite Record And Rising CO2 Emissions
Posted: March 2, 2018 Filed under: Climate Fraud, Climate models, Climatism, Data Tampering, Gavin Schmidt, Global Temperature, Global Warming Stasis, Govt Climate Agenda, Hockey Stick, NASA, NOAA, Satellite Data, The Pause, UAH | Tags: "The Pause", Carl Mears, Climate Change, climate fraud, Climate science, Data Fraud, Data Sets, Data Tampering, Dr Roy Spencer, Earth Sciences, Gavin Schmidt, GISS, GISTEMP, Global Temperature, Global Warming, Global Warming "Pause", Global Warming Hiatus, John Christy, RSS, Satellite Data, UAH Leave a comment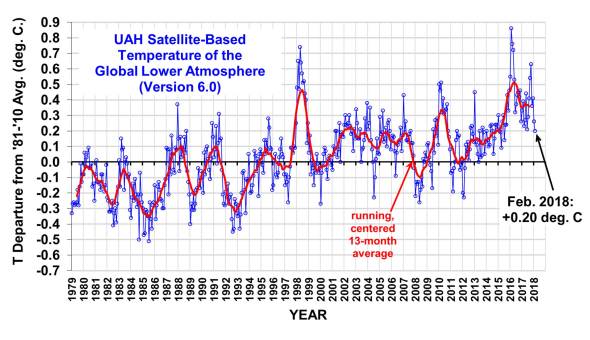
UAH Global Temperature Update for February, 2018: +0.20 deg. C « Roy Spencer, PhD
GLOBAL temps continue their cooling trend, rebounding off the 2015/16 Super El Niño – the strongest since accurate measurements began, caused by surface waters in the Pacific Ocean, west of Central America rising up to 3C warmer than usual.
THE latest UAH V6.0 February anomaly of +0.20 brings temperatures back to the levels they were at after the 1998 El Niño.
UAH Feb data and results here…
*
MEASURING GLOBAL TEMPERATURES – Satellites Vs Thermometers?
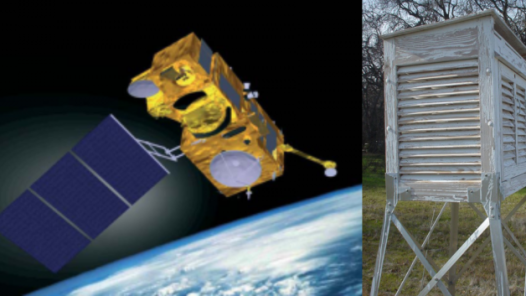
Satellites
NASA’s MSU satellite measurement systems, generate the RSS and UAH datasets, which measure the average temperature of every cubic inch of the lower atmosphere, the exact place where global warming theory is meant to occur.
BEFORE 2016, UAH and RSS both tracked closely showing very little warming in their data sets which led to the identification and validation of “the pause” in global warming which has since become the subject of much research and debate in peer-reviewed scientific journals.
From the RSS website:
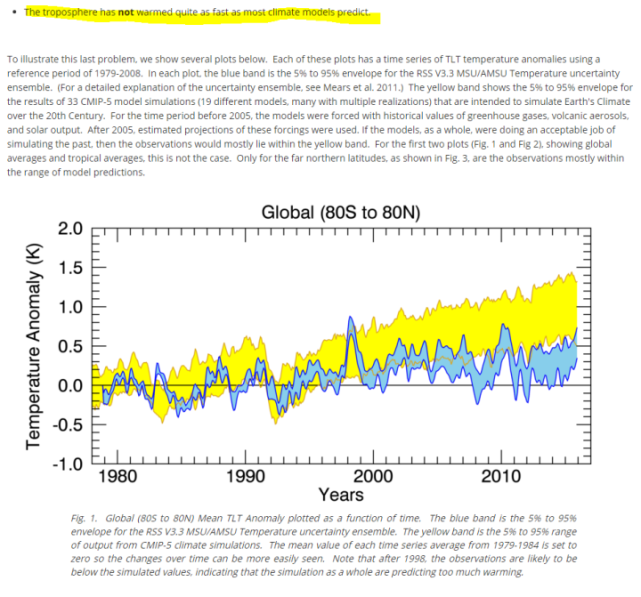
Source: http://www.remss.com/research/climate Archived here – http://www.webcitation.org/6fiQcrQDQ
HOWEVER, by 2016, Carl Mears, who is the chief scientist for RSS (Remote Sensing Systems) and who has used the pejorative “denialist” in various correspondence, decided that “the pause” was not a good look for the global warming narrative so RSS was massively adjusted upwards, conveniently eliminating “the pause” in the RSS dataset.
Mears’ objectivity towards the business of global temperature data collection and reporting can be found in his commentary on his website:

Source: http://www.remss.com/blog/recent-slowing-rise-global-temperatures Archived here: http://www.webcitation.org/6fiS2rI7k
MEARS then published a paper claiming that new and improved adjustments have “found” that missing warming.
Mears, C., and F. Wentz, 2016: Sensitivity of satellite-derived tropospheric
temperature trends to the diurnal cycle adjustment. J. Climate. doi:10.1175/JCLID-
15-0744.1, in press.
http://journals.ametsoc.org/doi/abs/10.1175/JCLI-D-15-0744.1?af=R
THE result…
Differences between the old version and new version of RSS:

Fig. 8. Comparison between RSS V3.3 global (80°S to 80°N) anomaly time series, and result from the V4.0 merging algorithm with different levels of adjustments applied.
(Data and research via WUWT)
*
UAH is the satellite data set featured in this post and is jointly run by Dr. John R. Christy – Distinguished Professor of Atmospheric Science and Director of the Earth System Science Center at The University of Alabama in Huntsville. And Roy Spencer Ph.D. Principal Research Scientist at the University of Alabama in Huntsville.
Spencer commentary on the divergence between RSS and UAH post “adjustment”:
“We have a paper in peer review with extensive satellite dataset comparisons to many balloon datasets and reanalyses. These show that RSS diverges from these and from UAH, showing more warming than the other datasets between 1990 and 2002 – a key period with two older MSU sensors both of which showed signs of spurious warming not yet addressed by RSS. I suspect the next chapter in this saga is that the remaining radiosonde datasets that still do not show substantial warming will be the next to be “adjusted” upward.
The bottom line is that we still trust our methodology. But no satellite dataset is perfect, there are uncertainties in all of the adjustments, as well as legitimate differences of opinion regarding how they should be handled.
Also, as mentioned at the outset, both RSS and UAH lower tropospheric trends are considerably below the average trends from the climate models.
And that is the most important point to be made.”
Comments on the New RSS Lower Tropospheric Temperature Dataset « Roy Spencer, PhD
(Climatism bolds)
*
Thermometers
THIS epic twitter conversation between NASA GISS’ chief climate commissar Gavin Schmidt and @7Kiwi captured an epic admission as to the spurious nature of the highly upwardly ‘adjusted’ NASA land-ocean temperature data set, that leads to the huge and widely recognised divergence between satellite observations, climate models and NASA’s GISS temp…
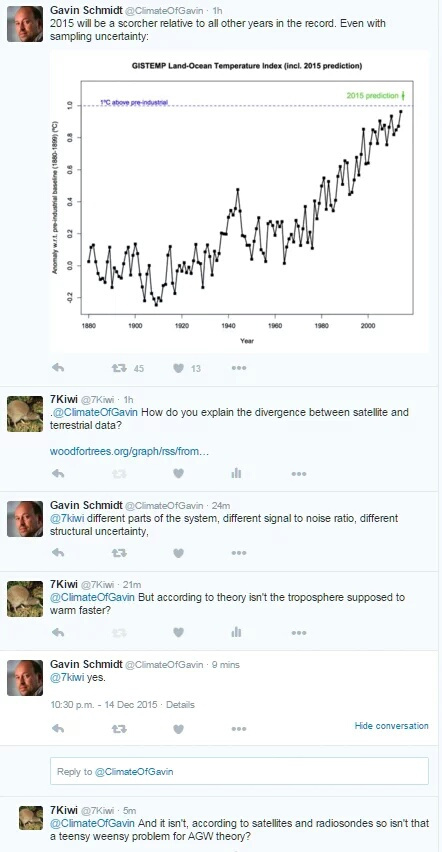
Gavin’s admission about the satellite record versus the surface temperature record | Climatism
A translation (square brackets) of Gavin’s admissions just for fun . Though many truths in it…
NASA and NOAA’s preferred surface-based thermometers measure “different parts of the system [UHI affected parking lots, asphalt heat sinks, AC exhaust air vents], different signal to noise ratio [we bias toward warm stations], different structural uncertainty [we ‘homogenise’ the data set to cool the past and warm the present to fit the global warming narrative].” – NASA GISS Gavin Schmidt’s admission about the satellite record versus the surface temperature record
More info on NASA GISTEMP: Data.GISS: GISS Surface Temperature Analysis (GISTEMP)
*
IT’S not difficult to see why the NASA data set is the preferred go-to for global warming activists, mainstream media, the UN IPCC and politicians seeking to implement draconian climate policy on their citizenry…

Land-ocean temperature index, 1880 to present, with base period 1951-1980. The solid black line is the global annual mean and the solid red line is the five-year lowess smooth. The blue uncertainty bars (95% confidence limit) account only for incomplete spatial sampling. [This is an update of Fig. 9a inHansen et al. (2010).]
“The Pause” is well and truly wiped from the record, with vengeance!
C/w UAH satellite global temp data:
UAH Global Temperature Update for February, 2018: +0.20 deg. C « Roy Spencer, PhD
VISUALISING NASA / NOAA DATA FRAUD aka “Adjustments”
Alterations To Climate Data | The Deplorable Climate Science Blog
NASA has doubled global warming since 2001:

NASA Doubling Warming Since 2001 | The Deplorable Climate Science Blog
NASA make up make up record temperatures in countries where they have no thermometer data. NOAA’s current data in Africa and much of the rest of the world is fake:

The “HOTTEST YEAR EVAH” Meme Exposed | Climatism
NASA has massively altered their US temperature data since 1999, to make a 1930-2000 cooling trend disappear:

History Of NASA/NOAA Temperature Corruption | The Deplorable Climate Science Blog
SEE more extreme examples of NASA / NOAA temperature data fraud at Tony Heller’s superb resource: The Deplorable Climate Science Blog | “Science is the belief in the ignorance of the experts” – Richard Feynman
*
GOOD READ : Satellites / Thermometers
Measuring global temperatures: Satellites or thermometers?
via CFACT
January 26, 2016 by Dr. Roy Spencer
The University of Alabama in Huntsville
The official global temperature numbers are in, and NOAA and NASA have decided that 2015 was the warmest year on record. Based mostly upon surface
thermometers, the official pronouncement ignores the other two primary ways of measuring global air temperatures, satellites and radiosondes (weather balloons).
The fact that those ignored temperature datasets suggest little or no warming for about 18 years now, it is worth outlining the primary differences between these three measurement systems.
Three Ways to Measure Global Temperatures
The primary ways to monitor global average air temperatures are surface based thermometers (since the late 1800s), radiosondes (weather balloons, since about the 1950s), and satellites measuring microwave emissions (since 1979). Other technologies, such as GPS satellite based methods have limited record length and have not yet gained wide acceptance for accuracy.
While the thermometers measure near-surface temperature, the satellites and radiosondes measure the average temperature of a deep layer of the lower atmosphere. Based upon our understanding of how the atmosphere works, the deep layer temperatures are supposed to warm (and cool) somewhat more strongly than the surface temperatures. In other words, variations in global average temperature are expected to be magnified with height, say through the lowest 10 km of atmosphere. We indeed see this during warm El Nino years (like 2015) and cool La Nina years.
The satellite record is the shortest, and since most warming has occurred since the 1970s anyway we often talk about temperature trends since 1979 so that we can compare all three datasets over a common period.
Temperatures of the deep ocean, which I will not address in detail, have warmed by amounts so small — hundredths of a degree — that it is debatable whether they are accurate enough to be of much use. Sea surface temperatures, also indicating modest warming in recent decades, involve an entirely new set of problems, with rather sparse sampling by a mixture of bucket temperatures from many years ago, to newer ship engine intake temperatures, buoys, and since the early 1980s infrared satellite measurements.
How Much Warming?
Since 1979, it is generally accepted that the satellites and radiosondes measure 50% less of a warming trend than the surface thermometer data do, rather than 30-50% greater warming trend that theory predicts for warming aloft versus at the surface.
This is a substantial disagreement.
Why the Disagreement?
There are different possibilities for the disagreement:
1) Surface thermometer analyses are spuriously overestimating the true temperature trend
2) Satellites and radiosondes are spuriously underestimating the true temperature trend
3) All data are largely correct, and are telling us something new about how the climate system operates under long-term warming.First let’s look at the fundamental basis for each measurement.
All Temperature Measurements are “Indirect”
Roughly speaking, “temperature” is a measure of the kinetic energy of motion of molecules in air.
Unfortunately, we do not have an easy way to directly measure that kinetic energy of motion.
Instead, many years ago, mercury-in-glass or alcohol-in-glass thermometers were commonly used, where the thermal expansion of a column of liquid in response to temperature was estimated by eye. These measurements have now largely been replaced with thermistors, which measure the resistance to the flow of electricity, which is also temperature-dependent.
Such measurements are just for the air immediately surrounding the thermometer, and as we all know, local sources of heat (a wall, pavement, air conditioning or heating equipment, etc.) can and do affect the measurements made by the thermometer. It has been demonstrated many times that urban locations have higher temperatures than rural locations, and such spurious heat influences are difficult to eliminate entirely, since we tend to place thermometers where people live.
Radiosondes also use a thermistor, which is usually checked against a separate thermometer just before weather balloon launch. As the weather balloon carries the thermistor up through the atmosphere, it is immune from ground-based sources of contamination, but it still has various errors due to sunlight heating and infrared cooling which are minimized through radiosonde enclosure design. Radiosondes are much fewer in number, generally making hundreds of point measurements around the world each day, rather than many thousands of measurements that thermometers make.
Satellite microwave radiometers are the fewest in number, only a dozen or so, but each one is transported by its own satellite to continuously measure virtually the entire earth each day. Each individual measurement represents the average temperature of a volume of the lower atmosphere about 50 km in diameter and about 10 km deep, which is about 25,000 cubic kilometers of air. About 20 of those measurements are made every second as the satellite travels and the instrument scans across the Earth.
The satellite measurement itself is “radiative”: the level of microwave emission by oxygen in the atmosphere is measured and compared to that from a warm calibration target on the satellite (whose temperature is monitored with several highly accurate platinum resistance thermometers), and a cold calibration view of the cosmic background radiation from space, assumed to be about 3 Kelvin (close to absolute zero temperature). A less sophisticated (infrared) radiation temperature measurement is made with the medical thermometer you place in your ear.
So, Which System is Better?
The satellites have the advantage of measuring virtually the whole Earth every day with the same instruments, which are then checked against each other. But since there are very small differences between the instruments, which can change slightly over time, adjustments must be made.
Thermometers have the advantage of being much greater in number, but with potentially large long-term spurious warming effects depending on how each thermometer’s local environment has changed with the addition of manmade objects and structures.
Virtually all thermometer measurements require adjustments of some sort, simply because with the exception of a few thermometer sites, there has not been a single, unaltered instrument measuring the same place for 30+ years without a change in its environment. When such rare thermometers were identified in a recent study of the U.S., it was found that by comparison the official U.S. warming trends were exaggerated by close to 60%. Thus, the current official NOAA adjustment procedures appear to force the good data to match the bad data, rather than the other way around. Whether such problem exist with other countries data remains to be seen.
Changes in radiosonde design and software have occurred over the years, making some adjustments necessary to the raw data.
For the satellites, orbital decay of the satellites requires an adjustment of the “lower tropospheric” (LT) temperatures, which is well understood and quite accurate, depending only upon geometry and the average rate of temperature decrease with altitude. But the orbital decay also causes the satellites to slowly drift in the time of day they observe. This “diurnal drift” adjustment is less certain. Significantly, very different procedures for this adjustment have led to almost identical results between the satellite datasets produced by UAH (The University of Alabama in Huntsville) and RSS (Remote Sensing Systems, Santa Rosa, California).
The fact that the satellites and radiosondes – two very different types of measurement system — tend to agree with each other gives us somewhat more confidence in their result that warming has been much less than predicted by climate models. But even the thermometers indicate less warming than the models, just with less of a discrepancy.
And this is probably the most important issue…that no matter which temperature monitoring method we use, the climate models that global warming policies are based upon have been, on average, warming faster than all of our temperature observation systems.
I do believe “global warming” has occurred, but (1) it is weaker than expected, based upon independent satellite and weather balloon measurements; (2) it has been overestimated with poorly adjusted surface-based thermometers; (3) it has a substantial natural component; and (4) it is likely to be more beneficial to life on Earth than harmful.
About the Author: Dr. Roy Spencer
Roy W. Spencer is a Principal Research Scientist at the University of Alabama in Huntsville. He received his Ph.D. in Meteorology from the University of Wisconsin in 1981. As Senior Scientist for Climate Studies at NASA’s Marshall Space Flight Center, Dr. Spencer previously directed research into the development and application of satellite passive microwave remote sensing techniques for measuring global temperature, water vapor, and precipitation. He is co-developer of the original satellite method for precision monitoring of global temperatures from Earth-orbiting satellites. Dr. Spencer also serves as U.S. Team Leader for the Advanced Microwave Scanning Radiometer for EOS (AMSR-E) flying on NASA’s Terra satellite. He has authored numerous research articles in scientific journals, and has provided congressional testimony several times on the subject of global warming.
•••
UPDATE
NO Australian Under The Age Of 40 Has Experienced Any Global Warming
•••
“The Pause” related :
- THE Great Global Warming “Pause” | Climatism
“Hottest Year Evah” Meme via Dataset related :
- “HOTTEST YEAR EVAH” Claims Tell Us More About Global Warming PR Than Actual Science | Climatism
- The “HOTTEST YEAR EVAH” Meme Exposed | Climatism
- Understanding The “Hottest Year Evah” | Climatism
- “The Hottest Year Evah” | Climatism
- More “Hottest Year Evah” Nonsense | Climatism
Climatism Top Posts :
- LIFE Inside The Global Warming Bubble | Climatism
- CLIMATE CHANGE – The Most Massive Scientific Fraud In Human History | Climatism
- WESTERN Nations, Driven By A Global Agenda Of Climate Alarmism, Are Destroying Their Industries With Carbon Taxes And Promotion Of Expensive, Intermittent Green Energy | Climatism
- THE Greatest Threat To The Environment Is Not Affluence, It’s Poverty | Climatism
Climate Science related :
- 100% Of Climate Models Prove that 97% of Climate Scientists Were Wrong! | Climatism
- THE Climate Change Farce Explained By Two Expert “Scientists” | Climatism
- WORLD Leading Authority : Climate and Sea Level Science Is A “Quasi Religion” Hijacked By An Activist Agenda | Climatism
- THE “97% Consensus” Meme Further Discredited By 97 New Papers Supporting A Skeptical Position On Climate Alarm | Climatism
Source info :
- Comments on the New RSS Lower Tropospheric Temperature Dataset « Roy Spencer, PhD
- The ‘Karlization’ of global temperature continues – this time RSS makes a massive upwards adjustment | Watts Up With That?
- RSS Nobbled | NOT A LOT OF PEOPLE KNOW THAT
•••
PLEASE Tip The Climatism Jar To Help Keep The Good Fight Alive!
(Still waiting for that “big oil” cheque to arrive in the mail!)
Click this link for brief info…TQ, Jamie 🙂

•••

Recent Comments