
This Is Not About A Virus
Posted: July 1, 2020 Filed under: Alarmism Debunked, Alarmism uncovered, Alarmist media, Climatism, Communism, Coronavirus, Politics, Socialism | Tags: Alarmism, CDC, Communism, Coronavirus, COVID-19, COVID19, getTRUMP, H1N1, Hysteria, Lockdown, Mainstream media, November 2020, Obama, Plandemic, Politics, Socialism, Swine Flu, Tyranny 4 Comments
COVID1984
“The whole aim of practical politics is to keep the populace alarmed
(and hence clamorous to be led to safety)
by menacing it with an endless series of hobgoblins,
all of them imaginary.”
– H.L. Mencken
“Of all tyrannies a tyranny sincerely
exercised for the good of its victims
may be the most oppressive.”
– C. S. Lewis
***
H/t @Carbongate (Parler)
A few poignant graphics via Ice Age Now exposing a few inconvenient truths about a virus promoted as catastrophic that produces a 99% recovery rate.

This is not about the virus – Ice Age Now

This is not about the virus – Ice Age Now

This is not about the virus – Ice Age Now
This is not about the virus – Ice Age Now
*
COVID-1984
IF Obama and not Trump were in power, would a shutdown of the entire global economy even have been uttered? Let alone the coordinated press-driven panic over a virus with a 99% recovery rate. A virus that was known early on to pose the greatest threat to the elderly and infirm.
OBAMA’S PANDEMIC
According to the CDC, Obama’s 2009 H1N1 Swine Flu, that killed “151,700-575,400 people worldwide during first year” (COVID19 507,188 to date), didn’t only target the elderly and infirm:
“2009 flu pandemic primarily affected children and young and middle-aged adults…
CDC estimated that 151,700-575,400 people worldwide died from (H1N1)pdm09 virus infection during the first year the virus circulated.** Globally, 80 percent of (H1N1)pdm09 virus-related deaths were estimated to have occurred in people younger than 65 years of age.”
2009 H1N1 Pandemic (H1N1pdm09 virus) | Pandemic Influenza (Flu) | CDC
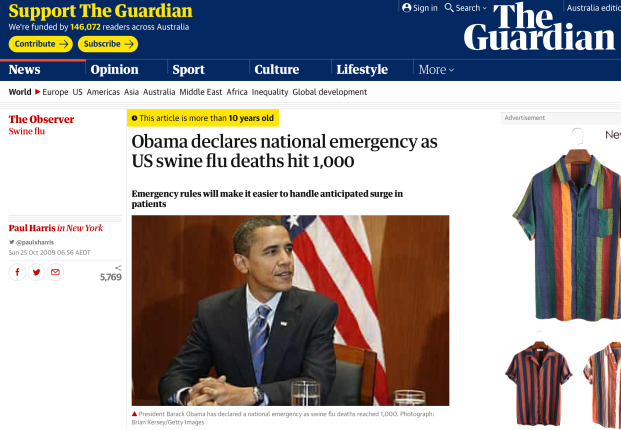
Obama declares national emergency as US swine flu deaths hit 1,000 | World news | The Guardian
*
TRUMP’S PLANDEMIC
Case Fatality Rate by age of TRUMP’s CV19 ‘Pandemic’ :
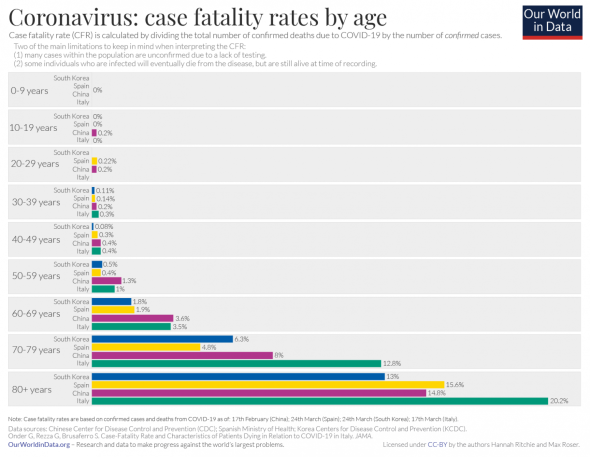
Mortality Risk of COVID-19 – Statistics and Research – Our World in Data
*
WHOSE virus, therefore, posed a greater threat to the entire population in order to justify and initiate a global lockdown? Obama’s or Trump’s?
KEEP in mind that the WHO told us, very early on, two crucial points about COVID–19:
- INFLUENZA CAN SPREAD FASTER THAN COVID-19 (Mar 6, 2020) : “The serial interval for COVID-19 virus is estimated to be 5-6 days, while for influenza virus, the serial interval is 3 days. This means that influenza can spread faster than COVID- 19.”

Coronavirus disease 2019 (COVID-19) Situation Report – 46
- NO CLEAR EVIDENCE OF HUMAN-TO-HUMAN TRANSMISSION (Jan 14, 2020) : “Preliminary investigations conducted by the Chinese authorities have found no clear evidence of human-to-human transmission of the novel #coronavirus (2019-nCoV) identified in #Wuhan, #China”
***
UPDATE – Masks, useless
Via @BeachMilk (Parler)
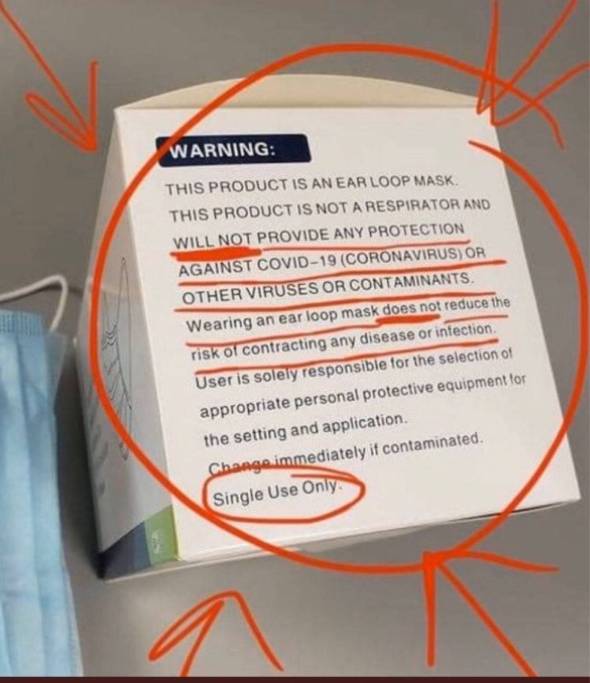
Via @BeachMilk (Parler)
***
UPDATE – Testing
THE CDC on COVID-19 testing :
What do your results mean?
If you test positive
- A positive test result shows you may have antibodies from an infection with the virus that causes COVID-19. However, there is a chance a positive result means that you have antibodies from an infection with a virus from the same family of viruses (called coronaviruses), such as the one that causes the common cold.
Test for Past Infection (Antibody Test) | CDC
*
OTHER ‘Coronavirus’ strains in circulation that caused ZERO panic, and ZERO lockdown :
- 229E (alpha coronavirus)
- NL63 (alpha coronavirus)
- OC43 (beta coronavirus)
- HKU1 (beta coronavirus)
- MERS-CoV (the beta coronavirus that causes Middle East Respiratory Syndrome, or MERS)
- SARS-CoV (the beta coronavirus that causes severe acute respiratory syndrome, or SARS)
- SARS-CoV-2 (the novel coronavirus that causes #coronavirus disease 2019)

Coronavirus | Human Coronavirus Types | CDC
*
UPDATE – CDC Double counting Covid-19
Via Real Climate Science :
CDC Sabotaging The Economy
The CDC is combining antibody and current infection tests, so that anyone who has ever had the virus counts as a positive. Using this methodology they will be able to maintain panic indefinitely, even if very few people are currently infected. realclimatescience.com/2020/07/cdc-sa
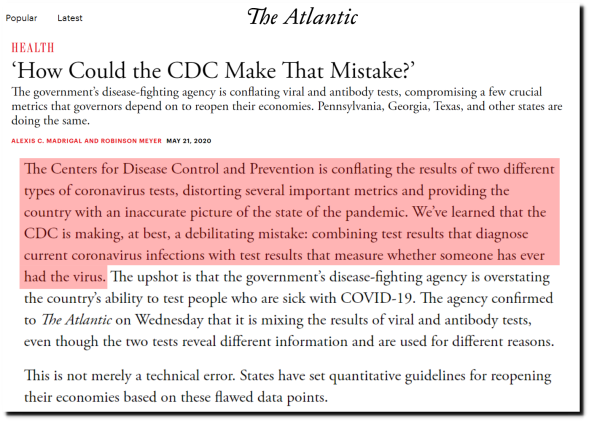
The CDC and States Are Misreporting COVID-19 Test Data – The Atlantic
*
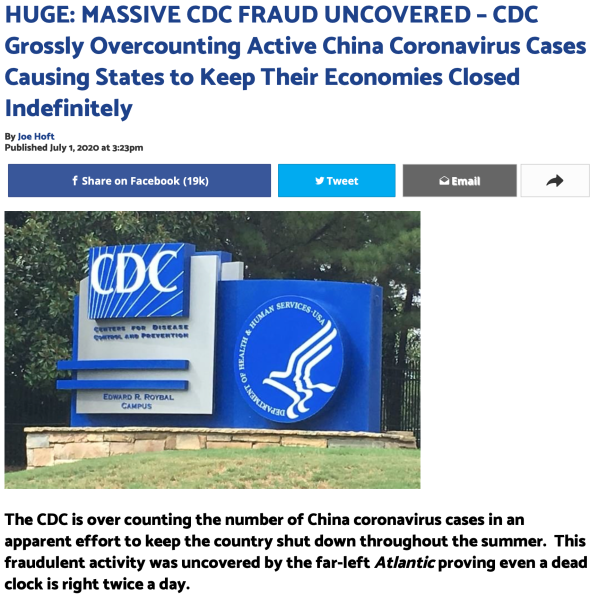
HUGE: MASSIVE CDC FRAUD UNCOVERED – CDC Grossly Overcounting Active China Coronavirus Cases Causing States to Keep Their Economies Closed Indefinitely
•••
COVID19 Related :
- FROM Terrorism to Climatism to Pandemism | Climatism
- MUST READ : End New York City’s Lockdown Now! | Climatism
- PLANDEMIC Part 1 (Dr. Judy Mikovits) | Climatism (Must watch)
- COVID19 : Totalitarianism Doesn’t Shock Us Anymore | Climatism
- MUST READ : A Wizard of Oz Virus – The COVID19 Hoax | Climatism
- COVID19 : A Must Watch | Climatism
- COVID18 : 80,000 Died Of The Flu Last Winter (2018) In The USA. Highest Death Count In Decades | Climatism
- CORONA-PANIC : A Fiasco In The Making? | Climatism
FOR the latest AU government information on COVID19 :
- Coronavirus (COVID-19) health alert | Australian Government Department of Health
ANXIETY? Need to speak to someone?
- Anxiety, depression and suicide prevention support – Beyond Blue
•••
THE Climatism Tip Jar – Support The Fight Against Dangerous, Costly and Unscientific Climate Alarm
(Climate sceptics/rationalists still waitin’ for that “big oil” cheque to arrive in the mail!)
Help us to hit back against the bombardment of climate lies costing our communities, economies and livelihoods far, far too much.
Thanks to all those who have donated. Your support and faith in Climatism is highly motivating and greatly appreciated!
Citizen journalists can’t rely on mastheads, rather private donations and honest content.
Click link for more info…
Many thanks, Jamie.
(NB// The PayPal account linked to “Climatism” is “Five-O-Vintage”)

•••
IGNORE Climate Hysteria : World Grain Crop Set To Break Record
Posted: August 3, 2019 Filed under: Alarmism Debunked, Alarmist media, Climate Change, Dud predictions | Tags: Climate Change, Climate Hysteria, Climatism, Crops, Dud Predictions, Food, food production, Global Warming, grain, Hysteria, Production 2 Comments“OUR changing climate is already making it more difficult to produce food” – @BarackObama 26 May, 2017
NOT A LOT OF PEOPLE KNOW THAT
By Paul Homewood

The International Grains Council July report lowered total grain production to 2.148 billion tonnes this season, with wheat production downgraded across the European Union, Russia and Canada.
The IGC report put total global wheat production at 763 million tonnes for the 2019-20 season, down on last month’s forecast of 769 million tonnes, but still higher than the 2018-19 production figure of 733 million tonnes.
“ … the global wheat out turn is seen at a record, while maize is placed at the second largest ever and barley at the highest in a decade,” the report said.
The Rabobank July agricommodity market research report, released last week, reported global wheat production to have been reduced by 9 million tonnes between last month and this month.
“With major exporter production reduced by 10 million tonnes amid a modest increase in production in the US, hot and dry weather across…
View original post 15 more words
COGNITIVE BIAS : Climate Change Alarmists Refuse To Accept ‘The Science’ That Proves Extreme Weather Events Are NOT Increasing
Posted: March 18, 2019 Filed under: Alarmism Debunked, Alarmism uncovered, Alarmist media, Alarmist Predictions, BIG Government, Climate Alarmism, Climate History, Climatism, Cyclones, Empirical Evidence, Extreme Weather, Fact Check, Fake News, Fires, Floods, Government Grants/Funding, Green Agenda, Green New Deal, Hurricanes, IPCC, Propaganda, Pseudo-Science, Science, Sea Level Rise | Tags: Agitprop, Alarmism Exposed, Climate Change, Climate Change Alarmism, Climatism, Cognitive Bias, Cyclones, drought, Empirical Evidence, Extreme weather, floods, Fox News, Global Warming, Global Warming Alarmism, Hurricanes, Hysteria, IPCC, Mainstream media, Patrick Moore, propaganda, sea level rise, Tornadoes, UN, UN IPCC 1 Comment
“WHEN the heart rules the head,
passion takes over reason.”
– Ortega y Gasset
“IT would not be impossible to prove with sufficient repetition and a psychological understanding of the people concerned that a square is in fact a circle. They are mere words, and words can be molded until they clothe ideas and disguise.”
― Joseph Goebbels
***
THE widely held belief that ‘Extreme Weather’ has become worse, as a result of man-made carbon dioxide emissions, is a tribute to the success of climate change propaganda pushed relentlessly by CO2-centric politicians and compliant mainstream media.
PROMOTING Extreme Weather is specifically designed to shift public opinion about the purported seriousness of human-induced global warming climate change, through the use of emotional imagery and dire prognostications in order for draconian and costly climate policy to be accepted and implemented with as little resistance as possible from the taxpaying public.
COGNITIVE BIAS fuelled by an era of mass hysteria, delusion, groupthink and panic has helped foster dark and far-fetched clichés of a current “climate crisis”, that is an “existential threat” which will “end civilisation by 2030”.
*
THANKS to the dramatic rise in personal weather recording devices – smart phones and CCTV – the sampling rate (what you see or hear directly) of Extreme Weather events, broadcast via social and mainstream media, has risen dramatically in recent years.
BUT, have actual Extreme Weather events increased in frequency or intensity? In particular, over long-term ‘climate’ scales?
THE short answer is a big fat NO! Extreme Weather events have not increased in frequency or intensity as carbon dioxide emissions have increased. In many cases the exact opposite is occurring.
THIS ‘inconvenient’ fact has been proven by empirical data and confirmed by the last two (warmist) U.N. IPCC reports on Extreme Weather: SREX (AR5) 2013 report and the latest SR15 report released August, 2018:
- SORRY ALARMISTS : The IPCC Once Again Reports Extreme Weather Events Have Not Increased | Climatism (SR15 2018)
- No steel roof required: IPCC dials back the fear of extreme weather | Climatism (SREX AR5 2013)
***
EXTREME WEATHER METRICS
DROUGHT
UN IPCC : “Low confidence in the sign of drought trends since 1950 at global scale…likely to be trends in some regions of the world, including increases in drought in the Mediterranean and W Africa & decreases in droughts in central N America & NW Australia” – UN IPCC SR15 (2018)
GLOBAL TREND
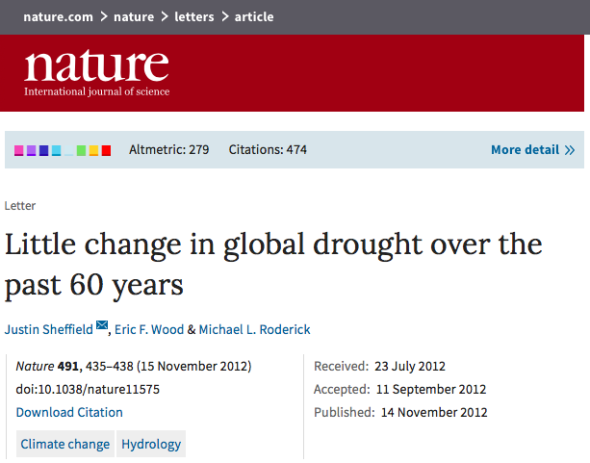
Little change in global drought over the past 60 years | Nature
*
NO historical trend in U.S. drought as CO₂ rises :
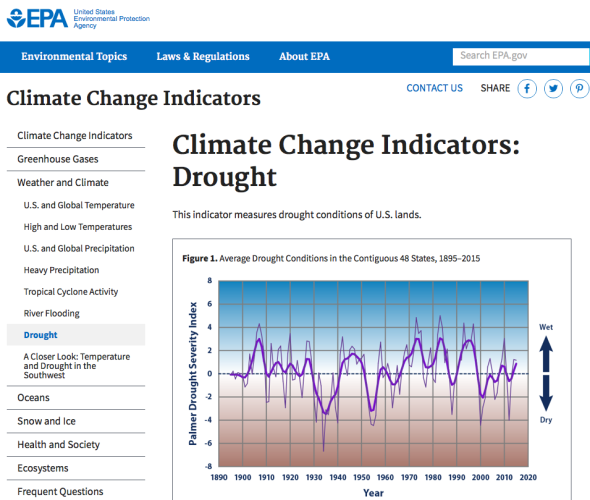
Climate Change Indicators – Drought | Climate Change Indicators in the United States | US EPA
*
1934 : WHEN CO₂ WAS AT ‘SAFE’ LEVELS
IN 1934, when CO₂ was at ‘safe’ levels, severe to extreme drought covered around 80% of the entire U.S. Such conditions endured for most of the decade known as the “Dust Bowl” era :
Historical Palmer Drought Indices | Temperature, Precipitation, and Drought | National Centers for Environmental Information (NCEI)
*
400 PPM ‘DANGEROUS’ CO₂
CURRENT U.S. drought conditions with CO₂ at ‘dangerous’ levels (400PPM) :
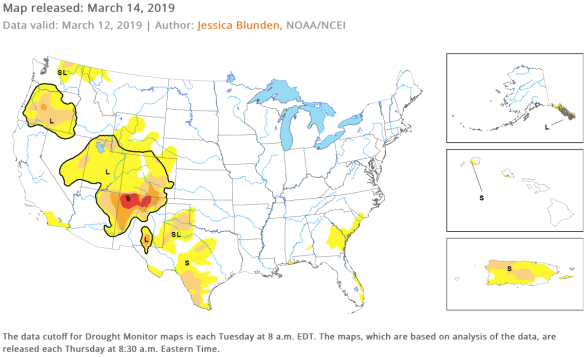
U.S. Drought Monitor
*
CALIFORNIA’s “PERMANENT DROUGHT” UPDATE
THANKS to superstitious climate kiddies wagging school, in just 3 years, California went from 97% in drought to just 1% :
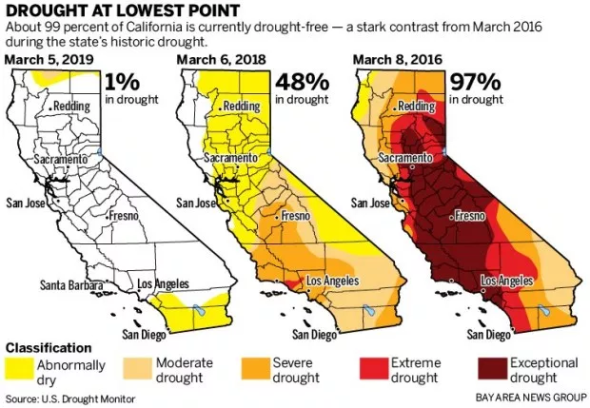
Tom Bevan on Twitter: “Pretty remarkable: In 3 years, California went from 97% in drought to just 1%.… “
*
WHEN CO₂ was at ‘safe’ levels, droughts in California lasted for 200 years :
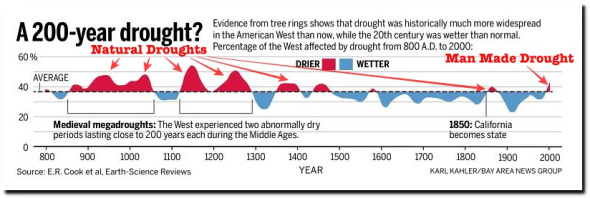
The Difference Between Weather And Climate | The Deplorable Climate Science Blog
***
FLOODS
“There is low confidence due to limited evidence, however, that anthropogenic climate change has affected the frequency and the magnitude of floods.” – UN IPCC SR15 (2018)
***
HEATWAVES
ACCORDING to the EPA, the low-CO2 1930s had (by far) the worst heatwaves in US history :
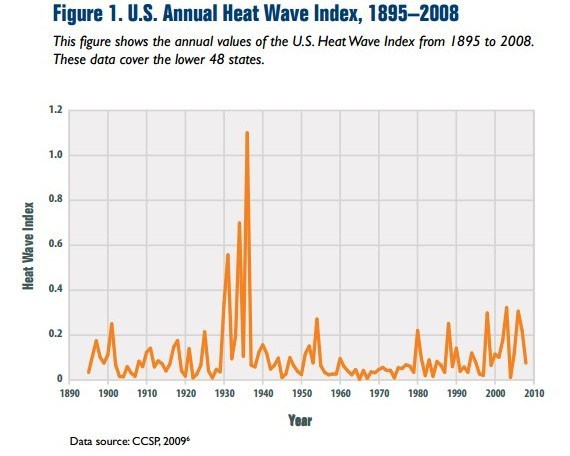
US Annual Heat Wave Index | EPA
*
WHEN CO₂ was at ‘safe levels’, Adelaide’s temperature climbed above 100°F, six days in a row.
ADELAIDE – March, 1940 :
- Friday – 24°C (74.4F)
- Saturday – 24°C (75.7F)
- Sunday – 28°C (81.7F)
- Monday – 34°C (93.5F)
- Tuesday – 31°C (88.4F)
- Wednesday – 35°C (94.9F)
- Thursday – 40°C (103.9F)
- Friday – 42°C (107.7F)
- Saturday – 43°C (110.1F)
- Sunday – 42°C (108.3F)
- Monday – 42°C (107.9F)
- Tuesday – 40°C (103.6F)


RECORD MARCH HEAT WAVE : Six Consecutive Days Above 100°F | Climatism
***
GLOBAL TROPICAL CYCLONES
“Numerous studies towards and beyond AR5 have reported a decreasing trend
in the global number of tropical cyclones and/or the globally accumulated cyclonic energy”– UN IPCC SR15 (2018)
“There is only low confidence regarding changes in global tropical cyclone numbers under global warming over the last four decades.” – UN IPCC SR15 (2018)
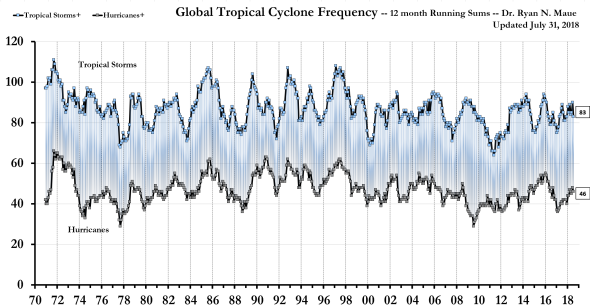
Global Tropical Cyclone Activity | Ryan Maue
*
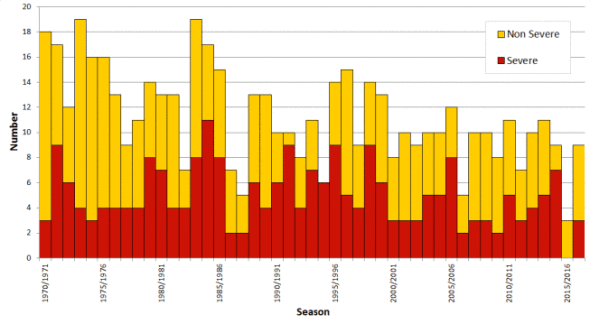
AUSTRALIAN TROPICAL CYCLONES
AUSTRALIAN tropical cyclones are declining in both intensity and frequency as CO₂ rises :
***
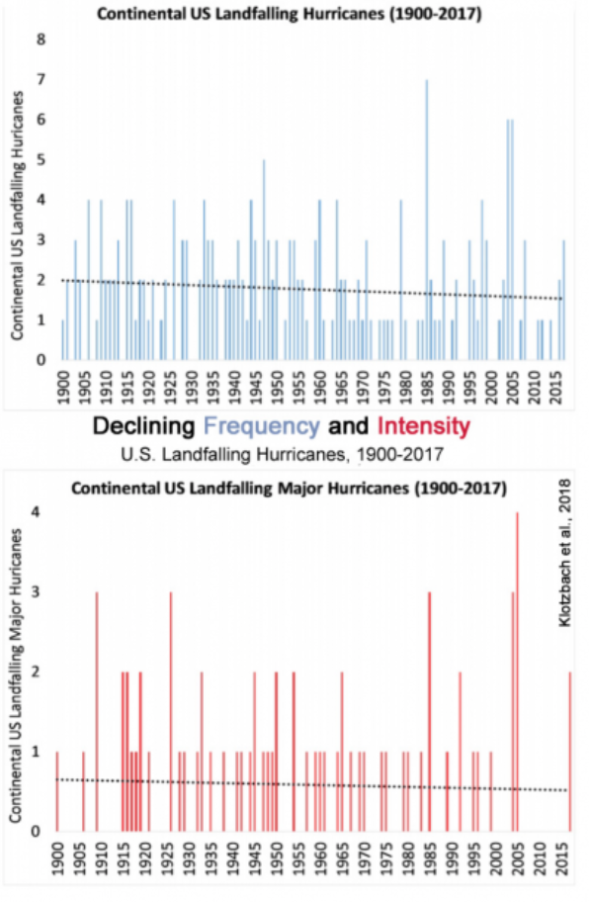
HURRICANES
GLOBAL Hurricanes are declining in both frequency and intensity as CO₂ increases :

Global Major Hurricane Frequency | Ryan Maue
*
Joe Bastardi: Climate Crisis? Four Major Metrics That Say Otherwise — The Patriot Post
*
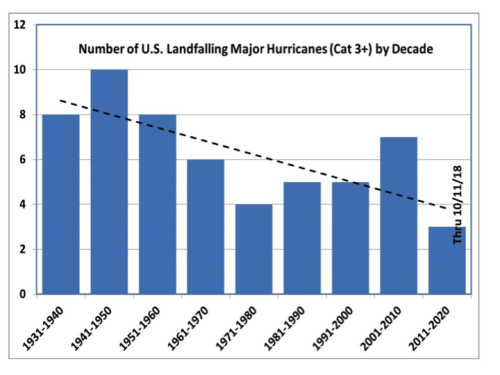
CAT 3+ U.S. Landfalling Hurricanes (per decade) declining rapidly as CO₂ emissions rise :
*
FLORIDA Major Hurricane Strikes – Still No Trend :
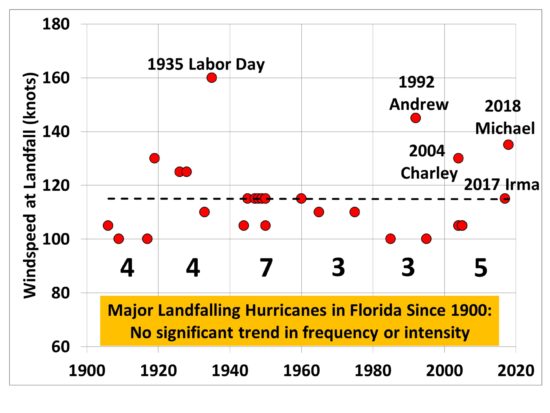
Florida Major Hurricane Strikes: Still No Trend « Roy Spencer, PhD
***
TORNADOES
2018 was one of the least active US tornado years on record, despite record and rising CO₂ emissions.
AS of October, a new record low tornado count was set. The cumulative total for 2018 is 759; the previous lowest number of tornadoes for this date was 761. The SPC has records extending back 65 years.
This lack of tornadic storms in recent years should also correlate with lesser severe thunderstorm activity in general in the U.S., since the conditions which produce large hail and damaging winds are generally the same as are required for tornadoes (strong instability, plentiful moisture, and wind shear). – Roy Spencer PhD
NB// The US represents about 75 percent of the world’s recorded tornadoes.
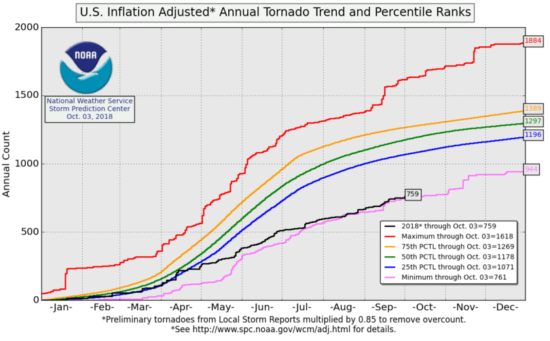
New Record Low Tornado Count as of October 3 « Roy Spencer, PhD
*
Joe Bastardi: Climate Crisis? Four Major Metrics That Say Otherwise — The Patriot Post
*
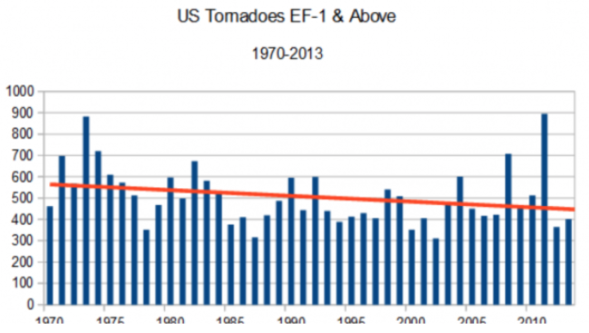
THE frequency of strong to violent tornadoes is also decreasing :
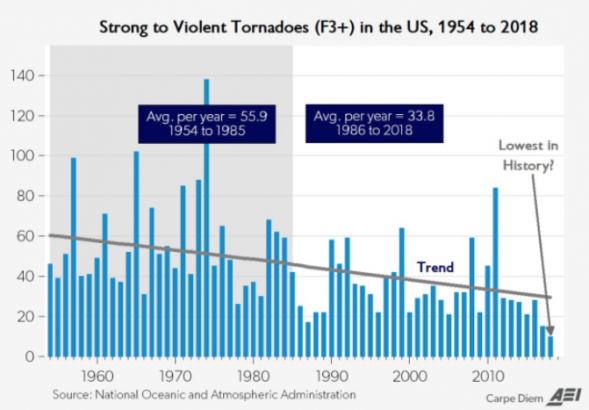
Joe Bastardi: Climate Crisis? Four Major Metrics That Say Otherwise — The Patriot Post
*

Joe Bastardi: Climate Crisis? Four Major Metrics That Say Otherwise — The Patriot Post
*
THE trend is clearly down across the board. Yet why are no mainstream journalists curious about this?
NB// IPCC SR15 “Extreme Weather” report made no mention of Tornadoes. Nor, the mainstream media!
***
GLOBAL WEATHER DISASTERS / LOSSES
GLOBAL weather disasters/losses as a percentage of global GDP are declining as CO₂ emissions rise.
THROUGH 7 months of 2018 weather disasters as % GDP were on record (low) pace…
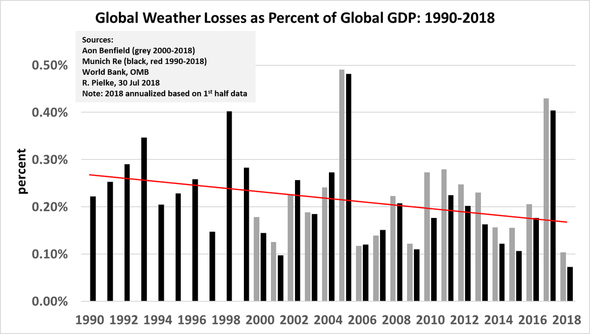
Weather disasters as % GDP – Roger Pielke Jr (Twitter)
NB// LOSS data does not include the two big CAT4’s that struck the US in 2018 – Florence (Sep) and Michael (Oct).
***
CONCLUSION
BIAS BY OMISSION
IN my opinion, the worst form of propaganda is ‘bias by omission’ – information and facts that you are ‘not’ told about, in order to keep the truth from you.
THE mainstream media has not and will not report the facts on “Extreme Weather”, as clearly laid out in the science and data above, because such facts are obviously extremely ‘inconvenient’ to their “catastrophic” man-made global warming narrative.
*
VITAL information central to the potential seriousness of climate change – Extreme Weather – has been purposely omitted by the mainstream media and replaced by emotions, alarmism and exaggerations in order to fit the climate-calamity narrative designed to scare you into belief and obedience.
THIS is why the global warming climate change debate has become so dangerously deceptive and dishonest. Climate truths hidden from you and replaced with a narrative far more acceptable – Hollywood-style climate hysteria based on alarmism, increased sampling rates and overheated, CO2-centric climate models that do not accord with observed reality.
•••
UPDATE
DID not see either of these instructive graphs painted on a placards at any of the kiddie climate rallies last Friday. Guess they don’t fit their ‘catastrophic’ climate narrative…
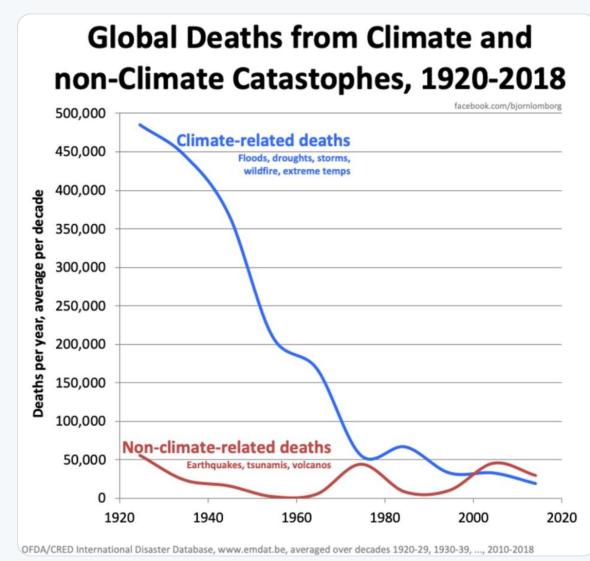
Global Deaths from Climate and non-Climate Catastrophes, 1920-2018
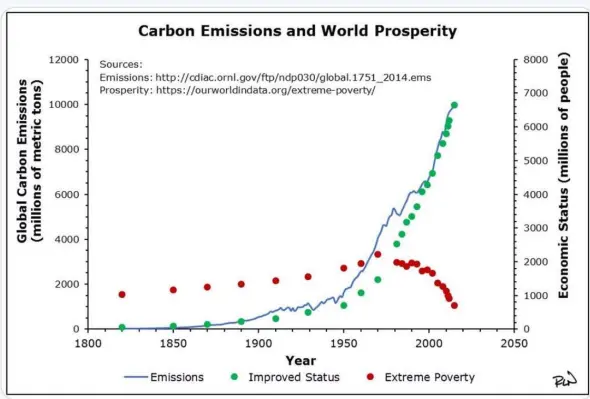
Carbon Emissions and World Prosperity
*
PERHAPS the climate kids would have been wise to read and learn the words of H.L. Mencken, before being forced out by their parents and teachers to act as standard bearers of new radical eco-socialism, protected by ‘innocence’ and lack of age :
“The whole aim of practical politics is to keep the populace alarmed (and hence clamorous to be led to safety) by menacing it with an endless series of hobgoblins, all of them imaginary. The urge to save humanity is almost always a false front for the urge to rule it.” – H.L. Mencken
•••
SUMMER Causes Climate Change Hysteria
Posted: July 10, 2018 Filed under: Alarmism Debunked, Alarmist media, Angry Summer, Climate Alarmism, Climatism, Empirical Evidence, Fact Check, Heat Wave | Tags: Alarmist Media, CAGW, Climate alarmism, Climate Change, Dr Roy Spencer, empirical data, Fact Check, Facts, Fake News, Global Warming, Global Warming Alarmism, Heatwave, Hysteria, Mainstream media, science Leave a comment
AFTER a brutally cold 2017/18 winter that witnessed record cold and snowfall across most of the Northern Hemisphere and snow again reaching all 50 states of the US, climate ambulance chasers have been eager to jump on recent heatwaves that have hit parts of the US and Europe…
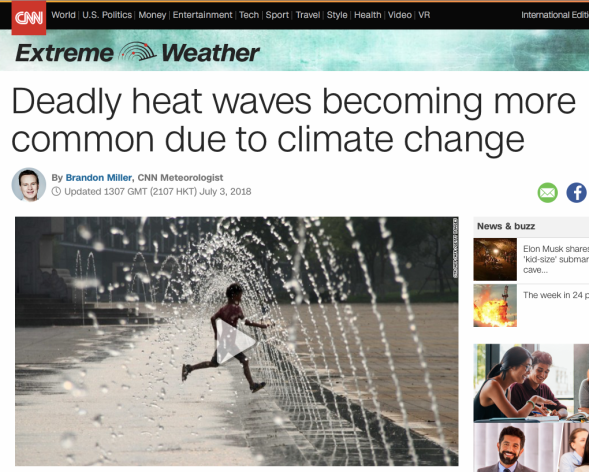
Deadly heat waves to become more common – CNN
*
ROY Spencer, PhD meteorologist with 40 years experience cools down the predicted hysteria with a healthy dose of stubborn facts and historical records that show nothing unusual about the latest ‘summer’ heatwaves…
*
Summer Causes Climate Change Hysteria
1933 : Australia’s Chief Weather Expert Said That Belief In Climate Change Is An “Error Of Human Memory”
Posted: May 5, 2018 Filed under: Australia, Climate Alarmism, Climate History, Climate History News | Tags: Alarmism, Australia, Bureau of Meteorology, climate, Climate Change, Climate Change Alarmsim, Climate history, Global Warming, Hysteria, Mainstream media, nature, Science and Environment Leave a commentA statement as true then as it is today. With the big difference today being that the public has been posiosned by political and media-induced mass climate hysteria and everyone is armed with a video phone to record climate disaster-porn that is used by the climate-crisis-industry as evidence of abrupt and “unprecedented” climate change, caused by your sinful existence.
Real Science
01 Feb 1933 – “CLIMATE NEVER CHANGES”
View original post
HOTTEST Arctic Ever? Arctic Climate Change Fairytales vs. Reality
Posted: March 10, 2018 Filed under: Alarmism, Alarmism Debunked, Antarctic, Antarctica, Arctic, Fact Check, Medieval Warm Period, Propaganda, Pseudo-Science | Tags: Alarmism, antarctic, Antarctica, arctic, Arctic alarmsim, Arctic Sea Ice, Climate alarmism, Climate Change, Earth Sciences, Environmental Science, Fake News, Global Warming, Greenland, Holocene, Hysteria, Medieval Warm Period, Nuuk, Roman Warming Period, Vijay Jayaraj, Weather, Weather alarmism 1 Comment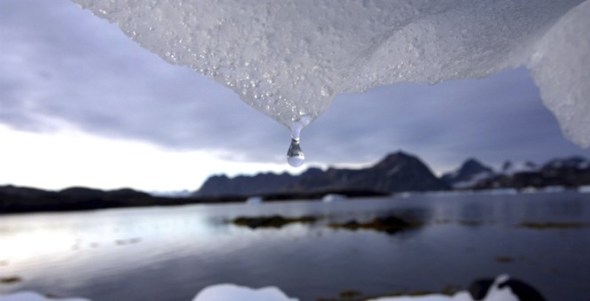
Hottest Arctic Ever? Arctic Climate Change Fairytales vs. Reality – Vijay Jayaraj
EXCELLENT piece by our friend and environmental scientist Vijay Jayaraj on the recent mass hysteria over the supposed “hottest day evah” in the Arctic.
Vijay’s piece, featured in Town Hall, demonstrates how the Climate Crisis Industry will latch on to any daily (hot) weather event in order to push their CAGW agenda yelling “GLOBAL WARMING” without any consideration for historical reference or indeed common sense…
“Those who count the Arctic warmth as evidence for global warming should count the Eurasian [cold] as evidence for global cooling”

This week, social media and mainstream media were abuzz with news about the record Arctic heat and how we humans are destroying our planet through climate change.
While we brace for a barrage of climate doomsday news, here is the actual reality of climatic conditions at the Arctic and reasons why we are not in imminent danger.
On 26 February, temperatures in some regions of the Arctic hovered around the freezing point (zero degree Celsius)—a record high for this time of year in the satellite era temperature readings (which began in the late 1970s).
But the current rise in Arctic temperature is due not to changes in global average temperature but to changes in regional weather patterns. Changes in the weather system across the Scandinavian region are pushing very warm, moisture-laden Atlantic air into the Arctic and very cold Arctic air into Northern Eurasia, leading much of Europe into a deep freeze this week.
(Those who count the Arctic warmth as evidence for global warming should count the Eurasian code [cold] as evidence for global cooling.)
The same has been prevalent over North America this week, resulting in a colder than normal winter in some parts while temperatures soar towards the east coast.
To understand the sudden peak in arctic temperatures, it is critical to analyze two key elements associated with the Arctic climate: 1. past temperature trends, and 2. the historic variations of the sea ice cover in the Arctic.
Temperature records for the Arctic reveal that the current rise in temperature is not unusual.
The weighted Arctic (70–90oN) monthly surface air temperature anomalies (from HadCRUT4) show that average surface temperatures in the Arctic have not increased significantly since the 1930s.
Long-term (1880–2018) Arctic surface annual air temperature series from Nuuk, Greenland, show that the high temperatures in the recent years are not significantly higher than the previous 14 decades.
Climate alarmists argue that these high temperatures lead to extreme reduction in sea ice levels and upset the eco-system of the planet.
However, sea ice variations reveal a similar pattern to that of temperature—there has been no extreme reduction of sea ice in recent decades.
The latest studies on Arctic sea ice indicate that sea ice cover during the 20th century did not depart significantly from the record sea ice levels during the Little Ice Age (1600–1700 AD).
And understandably, the sea ice cover was at its 2000-year low during the Medieval Warm Period (1000-1200 AD) and during the Roman Warm Period (around 0 AD).
If one were to consider longer temperature data series, such as the entire Holocene (the warm climatic era that constitutes the last 11,700 years approximately), we have no reason to panic about sea ice cover.
Sea ice cover in the 20th century was at its highest ever (excluding the Little Ice Age of 16thcentury) in the last 11,000 years.
Solar activity, and not carbon dioxide, was found to be the main reason for changes in the historical sea ice variations.
The current sea ice loss is not extraordinary by any means, and the Arctic ecosystem survived through much lower ice cover extent in the past 2000 years.
Lying about sea ice and temperatures is not new for the climate alarmists, and their hypocrisy will surely reach new heights this spring.
Vijay Jayaraj (M.Sc., Environmental Science, University of East Anglia, England), Research Associate for Developing Countries for the Cornwall Alliance for the Stewardship of Creation, lives in Coimbatore, India.
Hottest Arctic Ever? Arctic Climate Change Fairytales vs. Reality – Vijay Jayaraj |Town Hall
(Climatism bolds)
•••
MEANWHILE, as the climate mafia bloviates inside their WEATHER = CLIMATE bubble, the other conveniently forgotten pole, Antarctica, continues its long 40 year+ cooling trend, gaining ice mass despite record and rising CO2 levels and claims of “The Hottest Years Evah“…

From the abstract:
Mass changes of the Antarctic ice sheet impact sea-level rise as climate changes, but recent rates have been uncertain. Ice, Cloud and land Elevation Satellite (ICESat) data (2003–08) show mass gains from snow accumulation exceeded discharge losses by 82 ± 25 Gt a−1, reducing global sea-level rise by 0.23 mm a−1.
Mass gains of the Antarctic ice sheet exceed losses | Journal of Glaciology | Cambridge Core
*
DON’T MENTION THE SUN!
“The role of the lowest solar cycle for at least a century is mostly ignored by believers in man-made global warming. There are signs of climate change, but not necessarily the kind they expect.” – Rog Tallbloke
Icy Europe, balmy North Pole: the world upside down | Tallbloke’s Talkshop
•••
Related :
- Delingpole: NOAA Caught Lying About Arctic Sea Ice
- THERE’S Nothing Unprecedented About Our Current Weather – Booker | Climatism
- 8 INCHES Of Catastrophic Global Warming Cooks Dutch Canals | Climatism
- “THE PAUSE” Lives On : Global Temperatures Continue To Cool Despite Record And Rising CO2 Emissions | Climatism
- LIFE Inside The Global Warming Bubble | Climatism
- ARCTIC Alarmists Hit New Records Of Hysteria | Climatism
- “HOTTEST YEAR EVAH” Claims Tell Us More About Global Warming PR Than Actual Science | Climatism
- LIVING Life With “Atmosphere Cancer” | Climatism
Climate Science related :
- 100% Of Climate Models Prove that 97% of Climate Scientists Were Wrong! | Climatism
- THE Climate Change Farce Explained By Two Expert “Scientists” | Climatism
- WORLD Leading Authority : Climate and Sea Level Science Is A “Quasi Religion” Hijacked By An Activist Agenda | Climatism
- THE “97% Consensus” Meme Further Discredited By 97 New Papers Supporting A Skeptical Position On Climate Alarm | Climatism
- THE Great Global Warming “Pause” | Climatism
ARCTIC Alarmists Hit New Records Of Hysteria
Posted: February 28, 2018 Filed under: Alarmism Debunked, Alarmist media, Arctic, Climate Alarmism, Fact Check, Pseudo-Science | Tags: Alarmism, arctic, Climate Change, global cooling, Global Warming, Hysteria, snow, The Beast From The East, The Guardian Leave a commentIT’S been hard enough reconciling Moonbats opinion piece headline in the Guarduan – “That snow outside is what global warming looks like.”
https://www.theguardian.com/commentisfree/2010/dec/20/uk-snow-global-warmingNOW this Guardian double-down 🤦♂️
———
NICE reality check here…
NOT A LOT OF PEOPLE KNOW THAT
By Paul Homewood
The climate morons have hit new levels of hysteria about a day’s weather in the Arctic:
From the Guardian:

An alarming heatwave in the sunless winter Arctic is causing blizzards in Europe and forcing scientists to reconsider even their most pessimistic forecasts of climate change.
Although it could yet prove to be a freak event, the primary concern is that global warming is eroding the polar vortex, the powerful winds that once insulated the frozen north.
View original post 1,607 more words
EXTREME WEATHER Propaganda – The Pathway To Global Warming Hysteria
Posted: January 25, 2018 Filed under: Alarmism Debunked, Alarmist media, Carbon Dioxide, Climate science, Climatism, Drought, Empirical Evidence, Extreme Weather, Fact Check, Fires, Floods, Green Agenda, Hurricanes, Propaganda | Tags: Alarmist Media, auspol, Bushfires, Climate Change, Cyclones, drought, Extreme weather, Fake News, floods, Global Warming, Hurricanes, Hysteria, propaganda, Wildfires Leave a comment
WHEN building a product, a key element needed for its success is ’empathy’. It is vital for innovators to step into the consumers’ shoes to build relevant products. If a product addresses a pain point and offers a solution to take that pain away, then the product stands a good chance of being a hit!
THE “climate crisis” is like any other product, requiring a set of components executed efficiently and effectively so that it may thrive within the market place. Empathy has been a critical factor in the successful development of the global warming brand.
THE cuddly polar bear was initially chosen as the climate mascot, stimulating instant and long-lasting empathy for the cause.
BUT, the fluffy polar bear has its geographical limitations, and ‘inconveniently’, is far from endangered. So, a more ‘global’ phenomena has evolved to do the heavy-lifting, bringing climate calamity into every TV and iPhone on 24/7/365 rotation. “Extreme weather” was the chosen one and has been the gift that keeps on giving for “Climate Crisis Inc.” – taking advantage of any and every weather event, gobbling up the gullible in its propagandised path of eco-brainwashing.
*
EVEN though “weather” is not climate, the daily bombardment of climate disaster-porn via the mainstream media provides more than enough evidence for the casual observer to convince them that the climate is in fact changing as a direct result of human CO2 emissions.
HOWEVER, when you dive deeper into extreme weather metrics through the lens of government data and peer-reviewed science, as opposed to scary pictures and videos spewed out by the climate-obsessed fake news media, there really isn’t any data that supports the EW catastrophe meme. In fact, by most metrics, extreme weather events are becoming less extreme and less frequent as CO2 rises.
2017 seemed to be filled with bad weather news. But a deeper look at the global data suggests that attempts to link the last year’s extreme weather to climate change are highly misleading.
THIS excellent 6 minute video produced by the GWPF demonstrates precisely why – sadly – the mainstream (fake news) media, who have largely been captured by the radical environmental movement, cannot be trusted on anything climate change or global warming…
H/t Green Jihad
•••
EW Related :
- The Great “Extreme Weather” Climate Change Propaganda Con | Climatism
-
“We Do Not Know If The Climate Is Becoming More Extreme” | IPCC SREX 2012
- The Economist Peddles Extreme Weather Lies | Climatism
- OPEN Letter To The Bureau Of Meteorology – Tropical Cyclone Trends | Climatism
- EXTREME WEATHER Expert: “World Is Presently In An Era Of Unusually Low Weather Disasters” | Climatism
- Study: a ‘statistically significant downward trend since 1950 exists’ in hurricane landfalls | Climatism
Climate Scam Related :
- CLIMATE CHANGE – The Most Massive Scientific Fraud In Human History | Climatism
- “In Searching For A New Enemy To Unite Us, We Came Up With The Threat Of Global Warming” | Climatism
- Global Warming Is The Greatest And Most Successful Pseudoscientific Fraud In History | Climatism
- THE Climate Change Farce Explained By Two Expert “Scientists” | Climatism
1970’s Climate Hysteria : Global Cooling – The Coming Ice Age
Posted: October 8, 2017 Filed under: Alarmism Debunked, Alarmism uncovered, Carbon Dioxide, Climate Alarmism, Ecofascism, Environmentalism, Extreme Weather, Global Cooling, Global Temperature, Government Grants/Funding, Govt Climate Agenda, Green Agenda, Population Control, Propaganda, Pseudo-Science, Religion, Settled Science, UN, UNEP, UNFCCC | Tags: 1970's, Alarmism, CARBON DIOXIDE, Carbongate, Climate Change, Climate Change Scam, global cooling, Global Cooling Scare, Global Warming Scam, Global Warming Scare, Hysteria, Malthus, propaganda, Scare Mongering, Science and Environment, Scientific Fraud, UN, UNEP 2 Comments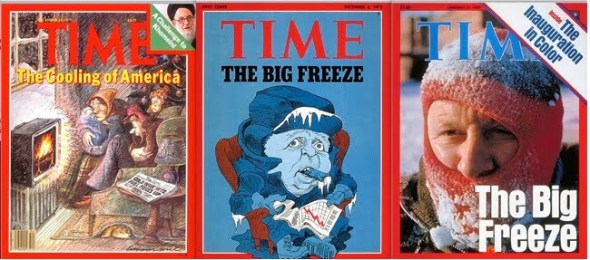
DEEP within human nature there are certain types of people who yearn for catastrophe, they yearn to have significance in their lives believing that theirs is the time when the chickens are coming home to roost and everything is going to go tits up.
THE biggest selling environmental books in history, predict the mass destruction of the planet. Rachel Carson’s 1962 international bestseller “Silent Spring” predicted mass cancer from plant pesticides and DDT. Paul Ehrlich’s “The Population Bomb” 1968, argued on malthusian lines that population explosion would mean mass starvation around the world. People buy this stuff. They lap it up and books like this sell in droves, in a way that more reasonable books that say “hang on, lets look at the facts”, don’t.
THIS short YouTube video via our friends @Carbongate needs no introduction, and is a must watch..
•••
1970’s Global Cooling (Climate Change) Eco-scare related :
- THE Climate Change Farce Explained By Two Expert “Scientists” | Climatism
- The 1970’s Global Cooling Compilation – looks much like today | Climatism
- BBC – Real risk of a Maunder minimum ‘Little Ice Age’ | Climatism
- 40 Years Since Climate Scientists Warned Us! The New Ice Age Is Going To Starve Us To Death | Climatism
- “In Searching For A New Enemy To Unite Us, We Came Up With The Threat Of Global Warming” | Climatism
- Cooling On The Warming: Now Warnings Of A Mini Ice Age | Climatism
- 1974 Shock News : CIA Said Global Warming Was A Good Thing | Real Science
MORE 1970′s Global Cooling Scare Related :
- Feds Alarmed By Global Cooling in 1974 | Climatism
- CIA 1974 National Security Threat : Global Cooling/Excess Arctic Ice Causing Extreme Weather | Real Science
- 1974 Shock News : CIA Said Global Warming Was A Good Thing | Real Science
- 1975 : Climatologists Wanted Permission To Melt The Arctic To Stop Disastrous Climate Change | Real Science
- 1972 : UN Scientists Wanted To Melt The Arctic By Spreading Soot On It | Real Science
- 1974 : NCAR Called Global Cooling The “New Norm” And Blamed Climate Disasters On It | Real Science
- 1970s Global Cooling Alarmism
- The New Crisis : The Same As The Old Crisis | Climatism
- 1922 US Government Shock News : Radical Change In Arctic Climate – Glaciers Gone | Climatism
- 1970s Global Cooling Scare | Real Science
- Every major climate organization endorsed the ice age scare, including NCAR, CRU, NAS, NASA – as did the CIA.
- 21 Jul 1976 – C.I.A. WARNING Changes to climate to bring upheaval
- Climate Change And Its Effect On World Food (1974)
- TIME – Weather – The Big Freeze
Renewables Work Just Fine – Provided There’s a Diesel in the Shed
Posted: April 27, 2017 Filed under: Australia, BIG Government, Carbon Dioxide, Climate Alarmism, Dud predictions, Energy Poverty, Fact Check, Failed Green Schemes, Fossil Fuels, Government Grants/Funding, Govt Climate Agenda, Green Agenda, Renewables, Solar, Unreliables, Wind Farms | Tags: carbon dioxide emissions, Carbon Emissions, climate, Climate Change Hoax, diesel backup, diesel power, Fossil Fuels, Global Warming Hoax, Green Energy Failure, Hysteria, Renewable energy, Tasmania, unreliables Leave a comment“Subsequently their politicians hurriedly put 150 diesel generators in their shed (costing A$11 million per month).”
THIS IS the result of Tasmania’s (job and economy wrecking) push for ‘unreliable’ green-energy sources based on fake global warming scares and climate change hysteria.
Another classic example of how “green” hysteria and global warming policies are doing far more damage than any prophesied weather or climate event could ever do by next century or when the so-called ‘experts’ predict.
Greens and green energy policies – “killing the earth to save it!”
STOP THESE THINGS

A Diesel in the Shed
Pickering Post
Viv Forbes
14 April 2017
You can have your solar panels
and your turbines on the hills;
You can use the warmth of sunshine
to reduce your heating bills.
You can dream you’re self-sufficient
as you weed your vegie bed;
As long as you make sure to keep
A diesel in the shed.
When I was a kid on a dairy farm in Queensland, we relied on green energy – horses and human muscles provided motive power; fire-wood and beeswax candles supplied heat and light; windmills pumped water and the sun provided solar energy for growing crops, vegies and pastures. The only “non-green” energy used was a bit of kerosene for the kitchen lamp, and petrol for a small Ford utility.
Our life changed dramatically when we put a diesel in the dairy shed. This single-cylinder engine drove the milking machines, the cream…
View original post 573 more words

Recent Comments