
Bombshell study: Temperature Adjustments Account For ‘Nearly All Of The Warming’ In Government Climate Data
Posted: July 7, 2017 Filed under: Climate Fraud, Data Tampering, Empirical Evidence, Fact Check, Global Temperature, Government Grants/Funding, Hockey Stick, Michael Mann, NASA, NOAA, Scientific Fraud | Tags: climate, Data Fraud, Data Tampering, Gavin Schmidt, GISS, Global Temperature, Global Warming Scam, HadCRUT, Hockey Stick, Michael Mann, nasa, NOAA, Scientific Fraud, Tom Karl 2 CommentsTHE emperor really has no clothes!
Earlier this week we learned Michael Mann and his fraudulent Hockey Stick have been slapped down in a Canadian court. Mann was ordered to produce the data on which his fake claim was based (as good science demands). He refused the request and Contempt of Court charges will follow!
Add EPA Pruitt’s “red team” to the mix and the house of climate cards is looking like a dangerous place to reside!
Don’t expect the Goebbels Media to utter a peep about any of this.
Watts Up With That?
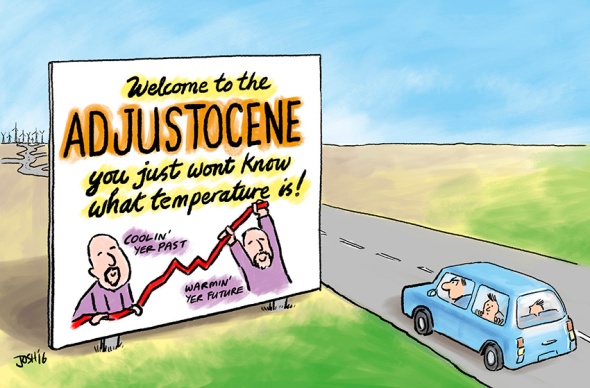 Cartoon by Josh at cartoonsbyjosh.com
Guest essay by Michael Bastasch
A new study found adjustments made to global surface temperature readings by scientists in recent years “are totally inconsistent with published and credible U.S. and other temperature data.”
“Thus, it is impossible to conclude from the three published GAST data sets that recent years have been the warmest ever – despite current claims of record setting warming,” according to a study published June 27 by two scientists and a veteran statistician.
The peer-reviewed study tried to validate current surface temperature datasets managed by NASA, NOAA and the UK’s Met Office, all of which make adjustments to raw thermometer readings. Skeptics of man-made global warming have criticized the adjustments.
Climate scientists often apply adjustments to surface temperature thermometers to account for “biases” in the data. The new study doesn’t question the adjustments themselves but notes nearly all of them increase the warming…
View original post 719 more words

In 2007, I wrote:
<>
Source:
http://activistteacher.blogspot.ca/2007/02/global-warming-truth-or-dare.html
LikeLike
The text of what I wrote in 2007 is:
IS THERE GLOBAL WARMING?
Before ‘climate chaos’ became cliché, many scientists advanced evidence for detected amounts of global average Earth surface temperature increases occurring in the post-industrial age. These reports, taken as a whole, were the main original catalysts towards constructing the global warming myth, so it is useful to critically examine their validity.
It was no easy task to arrive at the most cited original estimated rate of increase of the mean global surface temperature of 0.5 C in 100 years. As with any evaluation of a global spatio-temporal average, it involved elaborate and unreliable grid size dependent averages. In addition, it involved removal of outlying data, complex corrections for historical differences in measurement methods, measurement distributions, and measurement frequencies, and complex normalisations of different data sets – for example, land based and sea based measurements and the use of different temperature proxies that are in turn dependent on approximate calibration models. Even for modern thermometer readings in a given year, the very real problem of defining a robust and useful global spatio-temporal average Earth-surface temperature is not solved, and is itself an active area of research.
This means that determining an average of a quantity (Earth surface temperature) that is everywhere different and continuously changing with time at every point, using measurements at discrete times and places (weather stations), is virtually impossible; in that the resulting number is highly sensitive to the chosen extrapolation method(s) needed to calculate (or rather approximate) the average.
Averaging problems aside, many tenuous approximations must be made in order to arrive at any of the reported final global average temperature curves. For example, air temperature thermometers on ocean-going ships have been positioned at increasing heights as the sizes of ships have increased in recent history. Since temperature decreases with increasing altitude, this altitude effect must be corrected. The estimates are uncertain and can change the calculated global warming by as much as 0.5 C, thereby removing the originally reported effect entirely.
Similarly, surface ocean temperatures were first measured by drawing water up to the ship decks in cloth buckets and later in wooden buckets. Such buckets allow heat exchange in different amounts, thereby changing the measured temperature. This must be corrected by various estimates of sizes and types of buckets. These estimates are uncertain and can again change the resulting final calculated global warming value by an amount comparable to the 0.5 C value. There are a dozen or so similar corrections that must be applied, each one able to significantly alter the outcome.
In wanting to go further back in time, the technical problems are magnified. For example, when one uses a temperature proxy, such as the most popular tree ring proxy, instead of a physical thermometer, one has the significant problem of calibrating the proxy. With tree rings from a given preferred species of tree, there are all kinds of unavoidable artefacts related to wood density, wood water content, wood petrifaction processes, season duration effects, forest fire effects, extra-temperature biotic stress effects (such as recurring insect infestations), etc. Each proxy has its own calibration and preservation problems that are not fully understood.
The reported temperature curves should therefore be seen as tentative suggestions that the authors hope will catalyze more study and debate, not reliable results that one should use in guiding management practice or in deducing actual planetary trends. In addition, the original temperature or proxy data is usually not available to other research scientists who could critically examine the data treatment methods; nor are the data treatment methods spelled out in enough detail. Instead, the same massaged data is reproduced from report to report rather than re-examined.
The most recent thermometer measurements have their own special problems, not the least of which is urban warming, due to urban sprawl, which locally affects weather station mean temperatures and wind patterns: Temperatures locally change because local surroundings change. Most weather monitoring stations are located, for example, near airports which, in turn, are near expanding cities.
As a general rule in science, if an effect is barely detectable, requires dubious data treatment methods, and is sensitive to those data treatment methods and to other approximations, then it is not worth arguing over or interpreting and should not be used in further deductions or extrapolations. The same is true in attempting to establish causal relationships. This is in contrast to the precautionary principle which, in this context, would dictate that humans should reduce their fossil fuel burning because a resulting increase in atmospheric CO2 **might** cause serious environmental harm. I argue that we should stick to known consequences rather than potential ones – displacing people displaces people, clearing forests clears forests, etc. – and that we can apply universally accepted norms of human justice and respect for nature in limiting exploiters’ impulses.
LikeLike