
Are Scientists Preparing for a FlipFlop Back to Global Cooling Predictions?
Posted: July 3, 2016 Filed under: Alarmism Debunked, Alarmism uncovered, Alarmist media, Alarmist Predictions, Carbon Dioxide, Climate Changes, Climate Fraud, Climate models, Climate science, Cult Science, Dud predictions, Empirical Evidence, Fact Check, Failed Climate Models, Global Warming Stasis, Government Grants/Funding, Govt Climate Agenda, Green Agenda, IPCC, Scientific Fraud, UN, UNEP, UNFCCC, Warmism | Tags: Climate Scam, Climate science, failed climate models, Global Warming Scam, IPCC, UN Leave a commentWatts Up With That?
 Graph from p3768 of J. Hansen et al.: Ice melt, sea level rise and superstorms.
Guest essay by Eric Worrall
The alleged weakening of the Atlantic Meridional Overturning Circulation appears to be triggering a growing amount of speculation about abrupt cooling, like the plot of the movie “The Day After Tomorrow”.
Crippled Atlantic currents triggered ice age climate change
The last ice age wasn’t one long big chill. Dozens of times temperatures abruptly rose or fell, causing all manner of ecological change. Mysteriously, ice cores from Greenland and Antarctica show that these sudden shifts—which occurred every 1500 years or so—were out of sync in the two hemispheres: When it got cold in the north, it grew warm in the south, and vice versa. Now, scientists have implicated the culprit behind those seesaws—changes to a conveyor belt of ocean currents known as the Atlantic Meridional Overturning Circulation (AMOC).
These currents…
View original post 809 more words
Spectacular Drop In Global Average Satellite Temperatures
Posted: July 3, 2016 Filed under: Carbon Dioxide, Climate science, Empirical Evidence, Fact Check, Failed Climate Models, Global Cooling, Global Temperature, Global Warming Stasis, Green Agenda, Science, UAH | Tags: Dr Roy Spencer, global cooling, Global Temperature, Global Warming "Pause", Global Warming Hiatus, Global Warming Scam, Global Warming stasis, science, UAH satellite data Leave a commentThe current ~20 year global warming / climate change “hiatus/pause” set to continue (post El Niño), despite record and increasing CO2 emissions!
Global Warming theory check?
Watts Up With That?
UAH Global Temperature Update for June 2016: +0.34 deg. C
by Roy W. Spencer, Ph. D.
The Version 6.0 global average lower tropospheric temperature (LT) anomaly for June, 2016 is +0.34 deg. C, down 0.21 deg. C from the May value of +0.55 deg. C (click for full size version):
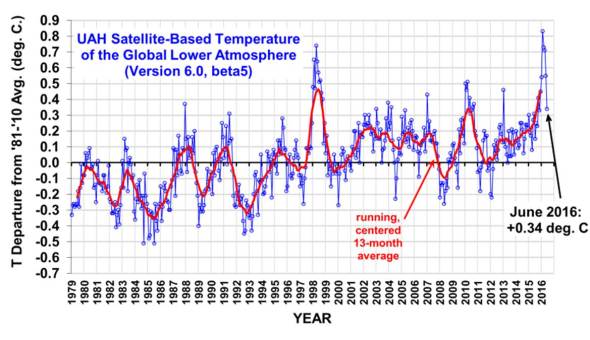
This gives a 2-month temperature fall of -0.37 deg. C, which is the second largest in the 37+ year satellite record…the largest was -0.43 deg. C in Feb. 1988.
In the tropics, there was a record fast 2-month cooling of -0.56 deg. C, just edging out -0.55 deg. C in June 1998 (also an El Nino weakening year). […]
The rapid cooling is from the weakening El Nino and approaching La Nina conditions by mid-summer or early fall.
As promised just over a week ago, here’s how we are now progressing toward a record warm year in the satellite…
View original post 607 more words
Big Drop In June Temperatures According To UAH
Posted: July 3, 2016 Filed under: Uncategorized Leave a commentThe current ~20 year global warming / climate change “hiatus/pause” set to continue (post El Niño), despite record and increasing CO2 emissions!
Global Warming theory check?
NOT A LOT OF PEOPLE KNOW THAT
By Paul Homewood
Roy Spencer has news of a big drop in satellite temperatures last month:
NOTE: This is the fifteenth monthly update with our new Version 6.0 dataset. Differences versus the old Version 5.6 dataset are discussed here. Note we are now at “beta5” for Version 6, and the paper describing the methodology is still in peer review.
The Version 6.0 global average lower tropospheric temperature (LT) anomaly for June, 2016 is +0.34 deg. C, down 0.21 deg. C from the May value of +0.55 deg. C (click for full size version):
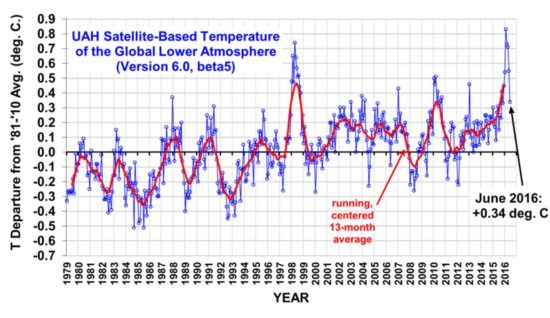
This gives a 2-month temperature fall of -0.37 deg. C, which is the second largest in the 37+ year satellite record…the largest was -0.43 deg. C in Feb. 1988.
In the tropics, there was a record fast 2-month cooling of -0.56 deg. C, just edging out -0.55 deg. C in June 1998 (also an El Nino…
View original post 187 more words

Recent Comments