
SHOCK NEWS! Arctic Summers Ice-Free by 2013
Posted: August 8, 2013 Filed under: Alarmism, Arctic, Climatism, Dud predictions, Global Cooling, Propaganda | Tags: Alarmism, arctic, Climate Change, global cooling, Global Warming 9 Comments“We need to get some broad based support,
to capture the public’s imagination…
So we have to offer up scary scenarios,
make simplified, dramatic statements
and make little mention of any doubts…
Each of us has to decide what the right balance
is between being effective and being honest.”
– Prof. Stephen Schneider,
Stanford Professor of Climatology,
lead author of many IPCC reports
“The only way to get our society to truly change is to
frighten people with the possibility of a catastrophe.”
– emeritus professor Daniel Botkin
“We’ve got to ride this global warming issue.
Even if the theory of global warming is wrong,
we will be doing the right thing in terms of
economic and environmental policy.”
– Timothy Wirth,
President of the UN Foundation
•••
According to 97% of the world’s top climate scientists, the Arctic will be ‘ice-free’ in a few weeks …

Professor Wedhams gives a two year reprieve …

Will Steffen of Australia’s Climate Commission reports a melting arctic and The emission of methane from the Arctic Ocean will wreak financial havoc:
“Warming is strongest in the northern high latitudes … An example is the loss of Arctic sea ice, which contributes to the thawing of the permafrost under the East Siberian Sea.” “Recent observations show that methane is beginning to bubble up … as the Arctic sea ice continues to retreat and the region continues to warm.”
- The release of the East Siberian Sea methane would lead to impacts worth about US$60 trillion (by comparison, the total value of the world’s economy in 2012 was about US$70 trillion, and the value of the Australian economy is about US$1.5 trillion).
Climate Commission and Steffen taking full advantage of the latest climate hysteria. An alarmist prediction so bad, even Gavin Schmidt thinks it is implausible!

ARCTIC ICE “Death Spiral” …
The ice is in a “death spiral” and may disappear in the summers within a couple of decades, according to Mark Serreze, an Arctic climate expert at the National Snow and Ice Data Center in Boulder, Colorado.
Paul Beckwith of Sierra Club Canada still thinks “Arctic sea ice will vanish” in a few weeks …

‘Serious’ Adult Arctic Alarmism
A CLOSER LOOK at the ice-free Arctic of summer 2013 …

From Real Science:
Second Largest Arctic Ice Gain On Record
Posted on Real Science August 8, 2013 by stevengoddardArctic ice area has increased by almost 20,000 Manhattans from this date last year, making it the second largest increase on record. The only year which gained more ice was 1996.
In a few days, it is likely that 2013 will move into the #1 spot.

arctic.atmos.uiuc.edu/cryosphere/timeseries.anom.1979-2008
2013 is the coldest Arctic summer on record:

COI | Centre for Ocean and Ice | Danmarks Meteorologiske Institut
UPDATE
The Arctic Displays Its Breathtaking Ignorance Of Peer Reviewed Climate Science
Posted on Real Science August 9, 2013 by stevengoddardTemperatures have plummeted below freezing weeks early.

COI | Centre for Ocean and Ice | Danmarks Meteorologiske Institut

UPDATE
50% Increase In Arctic Sea Ice Since Last Year
Posted on Real Science August 10, 2013 by stevengoddardGreen shows ice gain since August 8, 2012. Red shows ice loss over that period.

How it looks:


See also: Forget global warming! Earth undergoing global COOLING since 2002! (Climate Depot)
UPDATE
Arctic Sets New Record For The Largest Increase In Summer Sea Ice
Posted on Real ScienceAugust 12, 2013 by stevengoddardThis summer has seen the largest increase in sea ice area on record. August 8 ice area was 1.26 million km² larger than the same date in 2012, beating the old record increase set in 1996.

arctic.atmos.uiuc.edu/cryosphere/timeseries.anom.1979-2008
NOAA describes this record increase in ice as being a record loss.

Noaa report says Arctic sea ice is disappearing at unprecedented pace | World news | theguardian.com
UPDATE
Arctic Closed To Shipping – Too Much Ice
Posted on Real ScienceAugust 16, 2013 by stevengoddard

MASIE Home Page
UPDATE
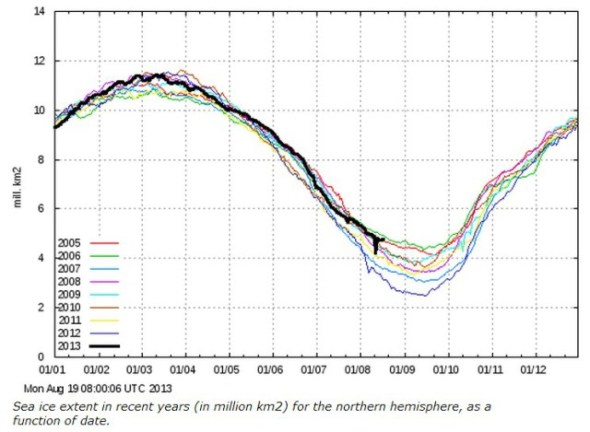
Second Slowest Peak Arctic Melt Season On Record
Posted on Real ScienceAugust 19, 2013 by stevengoddardSince July 23, Arctic ice area loss has been the second slowest on record. Ice loss has been 61% of normal, and was just slightly faster than 2001.

arctic.atmos.uiuc.edu/cryosphere/timeseries.anom.1979-2008
Climate experts tell us that Arctic sea ice is thin, decayed, rotten, and screaming, and that it is all going to melt away quite suddenly during the next week.
Arctic Announces That It Is Very Angry At Dishonest Scientists
Posted on Real ScienceAugust 19, 2013 by stevengoddardI just received this message from the Arctic
Government scientists shouldn’t claim 99% certainty of theorized cause and effect relationships – based entirely on preconceived notions and political prejudice.
Additionally, scientists who claim to be able to see the distant future are complete frauds.
COI | Centre for Ocean and Ice | Danmarks Meteorologiske Institut
Earth Blows Away The Record For Sea Ice Gain In 2013
Posted on Real ScienceAugust 22, 2013 by stevengoddardThe amount of thin, rotten, decayed, bald sea ice on Earth has increased by nearly 33,000 Manhattans since this date last year – almost doubling the previous record for annual ice gain.
Note that the amount of sea ice on Earth has increased during six of the last eight years.
NOAA says that these are the hottest years ever, and that the Arctic will soon be ice-free.

arctic.atmos.uiuc.edu/cryosphere/timeseries.global.anom.1979-2008
62% Increase In Arctic Ice Since Last Year
Green shows ice present in 2013 which was not present on this date in 2012. Red shows the opposite.

Arctic Sea-Ice Monitor
The Ministry Of Truth continues to lie about this :

This year’s melt rates are in line with a sustained decline of the Arctic ice cover, which has been monitored by NASA for several decades.
In the 1980′s the ice cap was about the size of the lower 48 states. It’s lost about half its size since then
Arctic ice cap points to sustaining increasing melt rates | abc7news.com
Arctic ice extent is the highest since 2005

COI | Centre for Ocean and Ice | Danmarks Meteorologiske Institut
69% Increase In Arctic Ice Since 2012
Green shows ice present in 2013 which was not present on this date in 2012. Red shows the opposite.

Arctic Sea-Ice Monitor
Largest Growth In Ice Area On Record
Arctic ice area has grown by 21,000 Manhattans since last year, the largest increase on record.
 arctic.atmos.uiuc.edu/cryosphere/timeseries.anom.1979-2008
UPDATE
Comparing Arctic Sea-Ice coverage: Aug 24, 2012 – 2013

http://igloo.atmos.uiuc.edu/cgi-bin/test/print.sh?fm=08&fd=24&fy=2012&sm=08&sd=24&sy=2013
UPDATE
Earth Gains 38,000 Manhattans Of Sea Ice – Blows Away The Old Record

arctic.atmos.uiuc.edu/cryosphere/timeseries.global.anom.1979-2008
Earth has gained 2.2 million km² of sea ice since this date last year, wiping out the previous record gain of 1.1 million km² in 1994.
According to climate experts, polar ice loss is the canary in the coal mine for global warming, meaning that their junk science theory has flown the coop. All they are left with is newspaper and cable news excrement at the bottom of the cage.
Arctic Ice Almost As Extensive As It Was 42 Years Ago
Green shows current ice. Red shows 1971 ice.
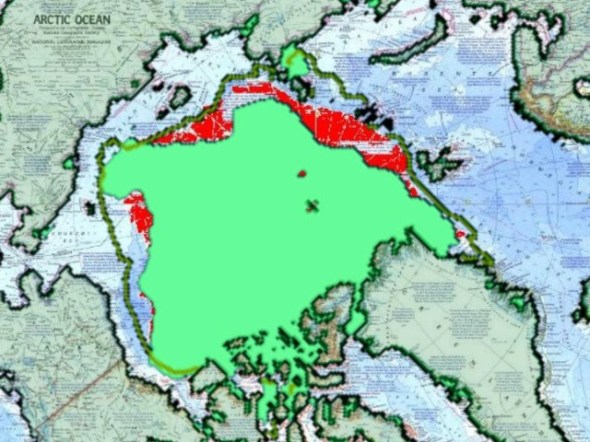
Arctic Ocean Map 1971 by National Geographic from Maps.com.
N_daily_extent.png (420×500)
The IPCC report from 1990 showed that ice extent was low in the early 1970s.

www.ipcc.ch/ipccreports/far/wg_I/ipcc_far_wg_I_full_report.pdf
NCAR also noted that prior to 1972, ice extent was low.
by Walter Orr Roberts Aspen Institute for Humanistic Studies, and National Center for Atmospheric Research, Boulder, Colorado
In February of 1972 earth-orbiting artificial satellites revealed the existence of a greatly increased area of the snow and ice cover of the north polar cap as compared to all previous years of space age observations.
www.iaea.org/Publications/Magazines/Bulletin/Bull165/16505796265.pdf
Alarmists want you to believe that there used to be a lot more ice, but they are lying.
UPDATE
Shock News : More Western Arctic Sea Ice Than 1981
Western Arctic ice coverage is higher than 1981, and is almost back to “normal.”

20130916180000_CVCHACTWA_0007271338.gif (1100×850)
UPDATE
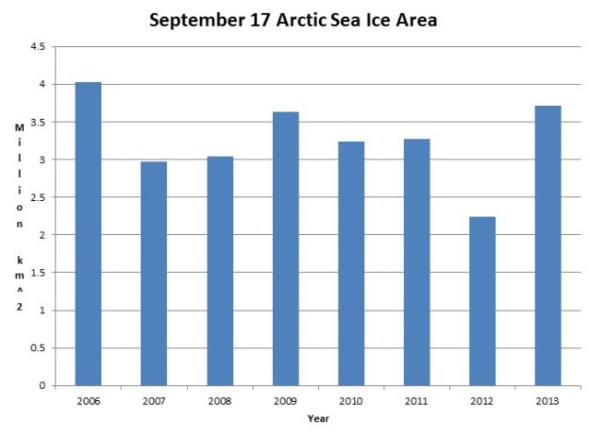
Gaia Pummels Arctic Alarmists
Arctic ice area the highest since 2006, and average ice area for the year to date is higher than 2006.

arctic.atmos.uiuc.edu/cryosphere/timeseries.anom.1979-2008
UPDATE

COI | Centre for Ocean and Ice | Danmarks Meteorologiske Institute
•••
UPDATE
Arctic Alarmists Will Long For The Summer Of 2013
This summer has been a disaster for Arctic alarmists, but it is only going to get worse. The bulk of remaining ice is perfectly situated in the western Arctic to survive the winter and become multi-year ice.
Another cold summer like this one, and western Arctic ice will be back to what alarmists call “normal” Look for great wailing and gnashing of teeth.
•••
UPDATE

The Cryosphere Today – Daily Arctic Sea Ice Maps
•••
GLOBAL SEA-ICE :
Earth Has More Sea Ice Than 1990
Planet Earth currently has 333,000 Manhattans of sea ice, which is more ice than on the same date in 1990. (Note that there was a small dip a few years ago which caused many leading scientists to become hysterical.)

timeseries.global.anom.1979-2008
Climate experts say that the poles are melting down, because they never look at any actual data.
•••
Climatism Links:
- NATURE STUDY Confirms Global Warming Stopped 15 Years Ago | CACA
- Scientists talking about no warming
- Peer into the Heart of the IPCC, Find Greenpeace | CACA
- UN-Settled Science
- 44th Pacific “Sinking Islands” Extortion Forum | CACA
- 97% of climate models say that 97% of climate scientists are wrong | CACA
- Bureaucratic Dioxide
- A cooling consensus
- Modelling Climate Alarmism
- GLOBAL WARMING THEORY – Circular reasoning at its best
- Obamaclimate and Europe’s Green Energy Basket-Case | CACA
Australia Climate Related:
- Tim Flannery sacked, Climate Commission dismantled by Coalition | Herald Sun
- A win for Australia! Government scraps Climate Commission. « JoNova
- Flannery sacked | Herald Sun Andrew Bolt Blog
- Claim: Humans behind record Australian heat, research shows | CACA
- Australia’s Climate Comm: Propaganda Unit Blinded By Ideology | CACA
- Claim: Ocean Acidification Is Climate Change’s ‘Equally Evil Twin’ | CACA
- Australia’s record hottest 12 month period? Junk science say the Satellites | CACA
Happy Birthday to my Brother Tim today (August 8) … never far away.

Which way is the ice melt trending?
LikeLike
NSIDC likes to pretend Arctic ice has been declining steadily, by starting their graphs near the 1978 century maximum.
But sadly for them, the 1990 IPCC report captured the growth in ice prior to 1979:
http://www.ipcc.ch/ipccreports/far/wg_I/ipcc_far_wg_I_full_report.pdf
LikeLike
The graph you linked to only goes from 1975 to 1990. Why refer to such an outdated graph at all? How is that useful when we have more recent data? We can all make graphs go up or down (just like the IPCC?), by cherry picking dates. Here is 1953 to 2013 – the trend is unmistakable.
LikeLike
My post above referred to the IPCC (just like the IPCC). I meant NSDIC.
LikeLike
IPCC thought that graph was useful in 1990 for their inaugural WGI climate report … however…
Re data, unfortunately satellites only started Arctic measurements in 1979. So we have to rely on literal first-hand accounts and observations for any time before then. How accurate is any data before 1979? Is ‘cherry picking’ from 1979 century maximum, thus providing the downward trend some are after, a fair representation of historical extent?…we are after all only talking about 33 years of sat monitoring.
Is the decline of Arctic sea ice extent, proof of ‘man-made’ global warming? Historical records tend to disagree or show similar, if not much warmer periods and greater melt throughout our history:
Here’s some fantastic examples of ‘first-hand’ accounts and observations from press clippings etc of when the Arctic has been in warm cycles throughout human observable history (actually fascinating reading, if you’re into history….if)
Polar Meltdown:
http://stevengoddard.wordpress.com/polar-meltdown/
Northwest passage open:
http://stevengoddard.wordpress.com/northwest-passage/
1947 : International Agency Needed To Stop The Arctic Meltdown (Same story, different millennium)
http://stevengoddard.wordpress.com/2012/08/19/1947-international-agency-needed-to-stop-the-arctic-meltdown/
Let me know if you need any more information on the historical perspective.
Worth noting, it’s Important to look at so called ‘outdated’ graphs because strange things happen after data adjustments…especially when trying to ‘reconstruct or rewrite’ historical data or to simply ‘make your case’
Here’s a good example: http://stevengoddard.wordpress.com/spectacularly-poor-climate-science-at-nasa/
See (at bottom of post) here: https://climatism.wordpress.com/2013/08/07/smoking-gun-that-the-noaa-us-climate-extremes-index-is-100-fraudulent/
Have a good weekend Geoff,
J
LikeLike
You said, “Is the decline of Arctic sea ice extent, proof of ‘man-made’ global warming?” On it’s own, no. But it is part of a pattern of events that support the hypothesis that CO2 is a greenhouse gas. There is a very high probability of a causal link. Considering the seriousness of the consequences of global warming we should take the responsible approach and protect our future by reducing our CO2 output.
LikeLike
Water vapor is a greenhouse gas, how do we control that beastie?
LikeLike
Yes, H2O makes up 95% of all greenhouse gases, and contributes to ~70% of the greenhouse effect.
The plant feeding trace gas CO² makes up 3% of all GHG’s and man’s component to the atmosphere is 0.0012% or 12 parts per million.
The IPCC et al claim humans 12 parts per million addition to CO² is driving climate change and potential CAGW ~ not the sun, not the clouds, not PDO, AMO, not water vapour but 97% evil human CO². Their original brief by UNEP & WMO was to find the effect and human fingerprint of ONLY human CO² input and not Natural Variations. 20 years on and $100 Billion later, the IPCC is still yet to find the global signature of human CO².
The reason the IPCC’s CO²-centric climate models are failing so badly and are overheated by some 0.2°C to observed temps, is they do not factor in effects of the sun and other aforementioned natural variations, they merely use NV’s as amplifications. If CO² rises then so should everything else and the temperature should follow. But this is not happening and has not happened over past 16 years with flat temps since at least 1998. http://www.economist.com/news/science-and-technology/21574461-climate-may-be-heating-up-less-response-greenhouse-gas-emissions?fsrc=scn%2Ffb%2Fwl%2Fpe%2Fasensitivematter
97% of the world’s top scientists are now pondering whether Natural Variation plays a bigger role!? Sceptics could have told them this years ago, for nothing.
See also “Modelling Climate Alarmism” https://climatism.wordpress.com/2013/08/03/modelling-climate-alarmism/
And so if water vapour contributes ~70% of greenhouse effect then why not tax H2O? …. don’t have to be a genius to imagine the public outrage if you tried taxing water vapour.
Richard S. Lindzen, Ph.D. Professor of Atmospheric Science, MIT, describes the CO²-centric syndrome well (Caps added):
“CO² for different people has different attractions. After all, what is it? – it’s not a pollutant, it’s a product of every living creature’s breathing, it’s the product of all plant respiration, it is essential for plant life and photosynthesis, it’s a product of all industrial burning, it’s a product of driving – I mean, IF YOU EVER WANTED A LEVERAGE POINT TO CONTROL EVERYTHING from exhalation to driving, this would be a dream. So it has a kind of fundamental attractiveness to bureaucratic mentality.”
A final thought: If mother nature emits 97% of Carbon Dioxide into the atmosphere, does that mean she emits 97% Carbon “Pollution” into atmosphere?
LikeLike
With no statistically-significant global warming over the past 15-17 years as evidenced across all key data sets (RSS, UAH, hadCRUT, GISS) despite soaring CO² emissions over the same period, the AGW hypothesis isn’t looking so solid.
RSS: https://twitter.com/JWSpry/status/365142764356247552/photo/1
All Datasets: https://twitter.com/JWSpry/status/347739508520939521/photo/1
‘The Economist’ bombshell – doubts CO² sensitivity: http://www.economist.com/news/science-and-technology/21574461-climate-may-be-heating-up-less-response-greenhouse-gas-emissions?fsrc=scn%2Ffb%2Fwl%2Fpe%2Fasensitivematter
The upcoming IPCC AR5 climate report says there should have been 0.2ºC warming since 2005. HadCRUT data shows measured -0.02ºC cooling and a trend of -0.25ºC/century, or -0.08ºC/decade trend since 2002. https://twitter.com/JWSpry/status/365145453894983680/photo/1
These are silly timescales, however no atmospheric global warming since at least 1998 is rather significant, considering the entire Anthropogenic Global Warming scare was based on 22 years from 1976-1998.
Let’s also wait and see how the current cooling trend of the planet since 2002 goes. A dip back into the cold as evidenced by the climate shift since from 1998 (corresponding with the PDO shift and diminished solar activity) poses a much greater threat to humanity than any slight warming could ever. (despite what all the AGW alarmist fear-mongers will tell you).
Civilisation flourished during the Medieval and Roman warming periods, as well the ‘Holocene Climate Optimum Period’, named optimum for obvious reasons. The MWP and RWP periods were ‘globally’ 1-3ºC warmer than present. Vast amounts of peer-review studies prove this to be the case.
“This period of widespread warmth is notable in that there is no evidence
that it was accompanied by an increase of greenhouse gases” IPCC WG1 Report 1990 (p202)
http://www.ipcc.ch/ipccreports/far/wg_I/ipcc_far_wg_I_full_report.pdf
Medieval Warm Period Peer-Review: http://www.climatedepot.com/2013/03/08/More-than-700-scientists-from-400-institutions-in-40-countries-have-contributed-peerreviewed-papers-providing-evidence-that-the-Medieval-Warm-Period-was-real-global–warmer-than-the-present/?utm_source=feedburner&utm_medium=email&utm_campaign=Feed%3A+ClimateDepot+%28Climate+Depot%29&utm_content=Yahoo%21+Mail#.UTsoD2I2HL4.twitter
Living in a Little Ice Age: http://notalotofpeopleknowthat.wordpress.com/2011/11/01/what-was-life-like-in-the-little-ice-age/
Global Cooling: http://www.climatedepot.com/2013/06/15/forget-the-temperature-plateau-earth-undergoing-global-cooling-since-2002-climate-scientist-dr-judith-curry-attention-in-the-public-debate-seems-to-be-moving-away-from/
Global Warming Stopped: http://www.climatedepot.com/2013/06/04/long-list-of-warmist-scientists-say-global-warming-has-stopped/
Trenberth: “The Oceans Ate My Global Warming” » Not according to 3000 ARGO sat buoys operational since mid-2003: http://joannenova.com.au/2009/07/ocean-temperatures-the-new-bluff-in-alarmism/
ARGO system: http://www.abc.net.au/unleashed/28636.html
This is what happens to countries who embrace draconian hard-green ideology, fuelled by climate alarmism and fears of global catastrophe who then rush toward the ‘precautionary principle’: http://opinion.financialpost.com/2013/05/13/the-eu-green-hell/
LikeLike